| Analyte | Precursors | Synthesis Method | Linear Range (μmol/L) | LOD (μmol/L) | Response Time | Real Sample | Ref |
|---|---|---|---|---|---|---|---|
| F⁻ | Alizarin carmine and citric acid | Hydrothermal method | 150~1200 | 7.998 | 1 min | Tap water, Toothpaste, Milk | |
| TC | Bovine Serum Albumin (BSA) and Eu(NO3)3 | Hydrothermal method | 0~80 | 0.003 | 2 min | River water, Milk, Honey, Serum | |
| OTC | Spinach | Solvothermal method | 0~40 | 0.41 | 30 s | River water, Tap water, Mineral water, Milk, Pork | |
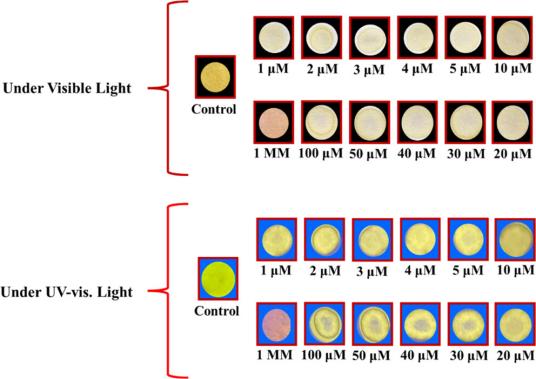
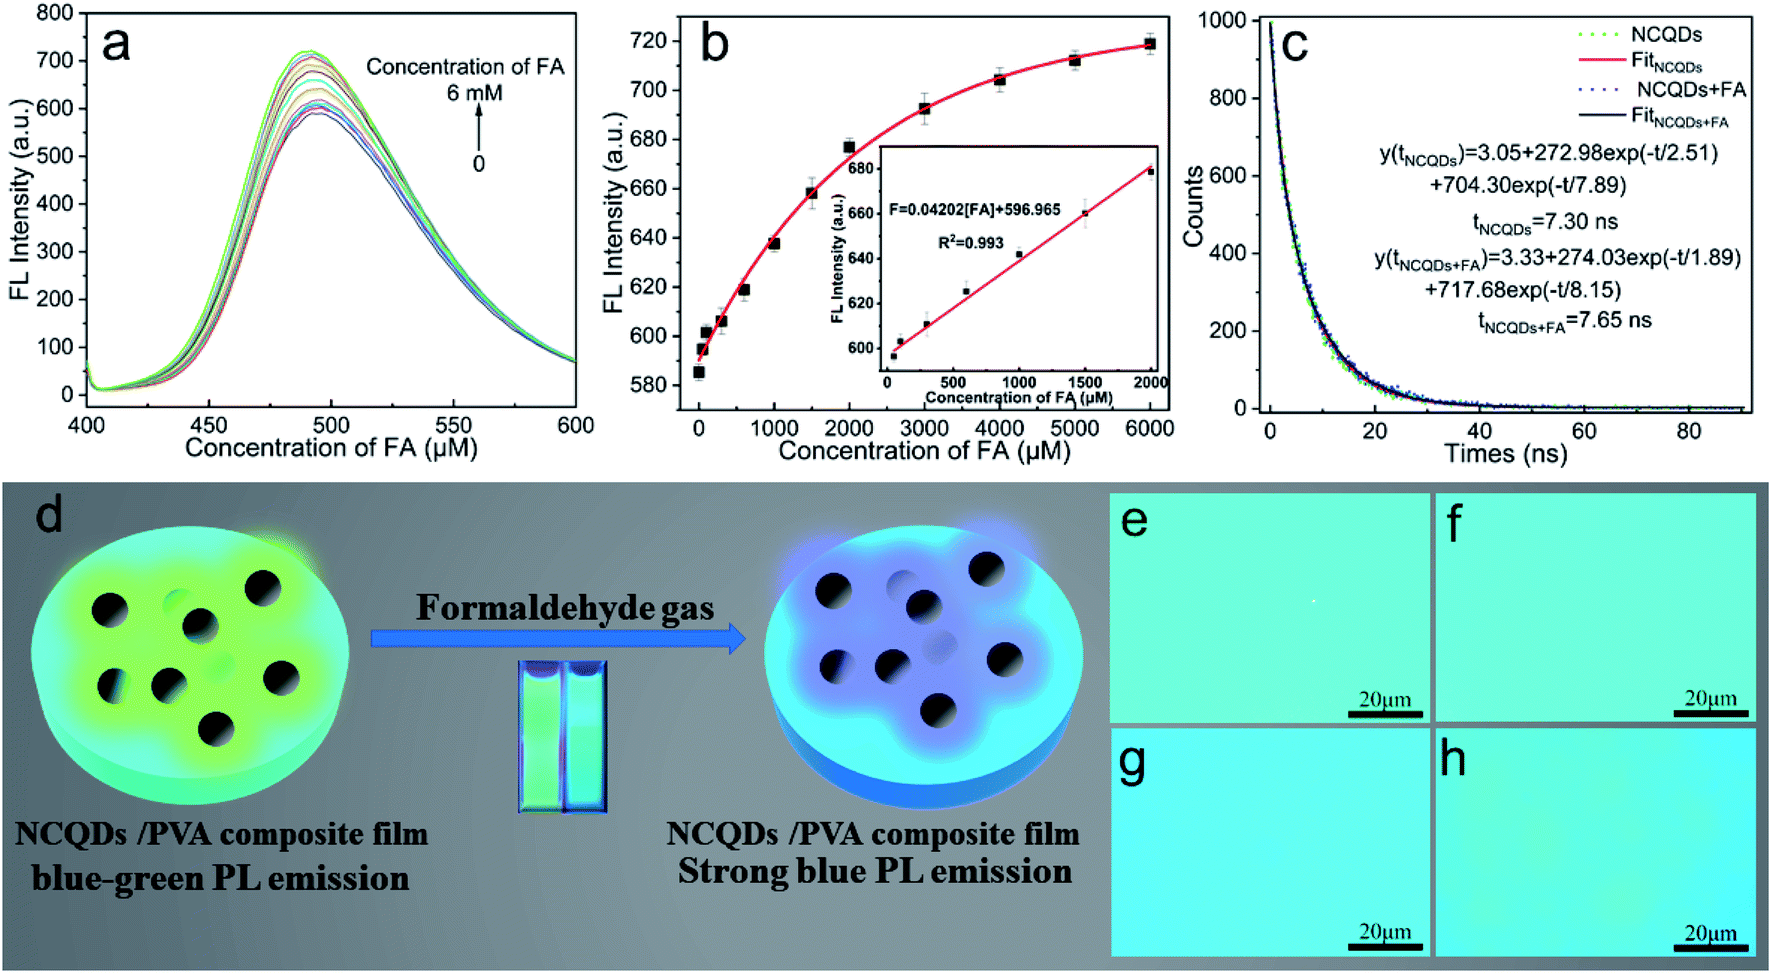
| FA | N-(phosphonomethyl)iminodiacetic acid (PMIDA) and branched polyethyleneimine (BPEI) | Hydrothermal method | 0~40 | 0.47 | 100 min | Bean sprout | |
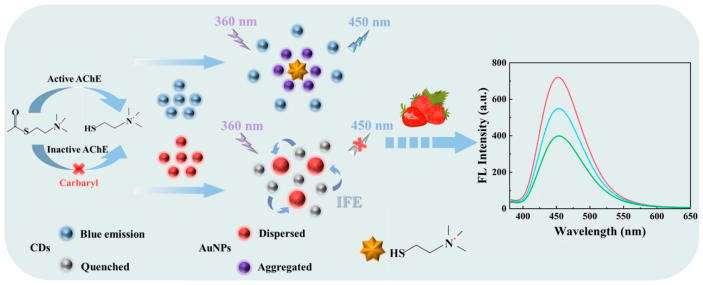
| Carbaryl | Citric acid and ethylenediamine | Hydrothermal method | 5×10⁻⁴~1 | 2.5×10⁻⁴ | 30 min | Strawberry | |
| Glyphosate | L-glutathione and formamide | Microwave-assisted | Low range: 0~59 High range: 0~2957 | 0.177 | - | - | |
| BPA | Sodium citrate and ethylenediamine | Hydrothermal method | 0.1~100 | 0.02 | 3 min | Tap water, River water, Lake water | |
| 4-NP | Melamine and o-phenylenediamine | Microwave radiation | 0.083~80 | 0.083 | 2 min | Tap water, Sewage, Yongjiang river water | |
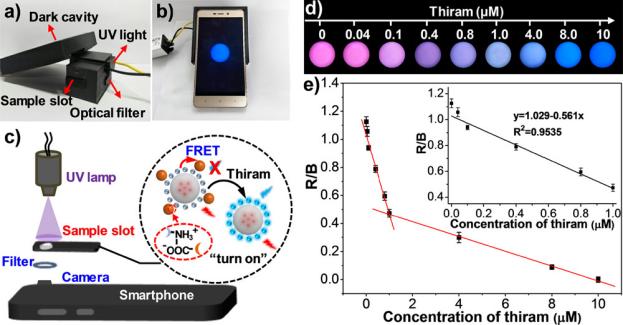
| Thiram | Citric acid and polyethylenimine | Solvothermal method | 0~10 | 0.059 | 4 min | Tap water, Apple peel, Milk. | |
| Chlorpyrifos | Citric acid and ethylenediamine | Hydrothermal method | 0.005~0.060 | 0.00145 | 60 min | Apple, Cabbage |