| Analyte | Precursors | Synthesis Method | Linear Range (μmol/L) | LOD (μmol/L) | Response Time | Real Samples | Ref |
|---|---|---|---|---|---|---|---|
| Fe3+ | Citric acid (CA) and melamine | Hydrothermal method | 20~80 | 3.18 | 15 min | Tap water, Sand lake water | |
| Fe3+ | 4,5-Difluoro-1,2-phenylenediamine and ethylenediamine | Hydrothermal method | 0.2~300 | 0.08 | <5 min | Laboratory water, Dormitory water | |
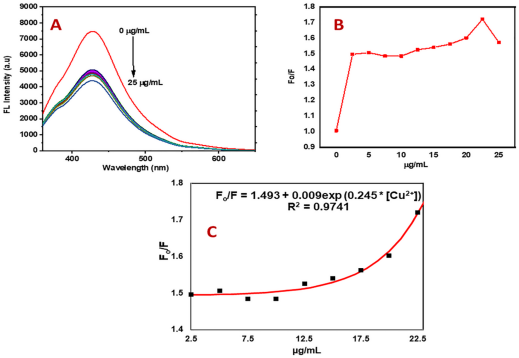
| Cu2+ | Pine-cone biomass | Microwave pyrolysis | 39.4~354.3 | 0.079 | 10 min | Wastewater effluent | |
| Cu2+ | Riboflavin (C₁₇H₂₀N₄O₆) and Fe₃O₄ | Hydrothermal method | 3.15~787.4 | 1.51 | 30 min | Tap water, River water | |
| Al3+ | Chitosan,and o-Phenylenediamine (OPD) | Microwave method | 10~100 | 0.2 | - | Tap water | |
| Hg2+ | Glutathione (GSH),ammonium ferric citrate (AFC),and diethylenetriamine (DETA) | solvothermal method | 0.008~0.08 | 0.0054 | 3 min | Tap water, Yellow sea water | |
| Co2+ | BTA and choline chloride | Hydrothermal method | 5~250 | 1.2269 | 1 min | Industrial wastewater | |
| Pb2+ | Fenugreek seeds | Hydrothermal method | 39.5~395 | 9.345 | 2 min | - | |
| Cr6+ | Phytic acid (PA) and L-arginine (Arg) | Hydrothermal method | 0.05~3 | 0.026 | 10 min | Water, Soil | |
| Cr6+ | Citric acid and ethylenediamine | Hydrothermal method | 0~10.2 | 0.11 | - | Tannery wastewater, Living cells | |
| S2⁻ | Melamine,and 2,4-difluorobenzoic acid | Hydrothermal method | 0~30 | 0.168 | 1.5 min | Tap water | |
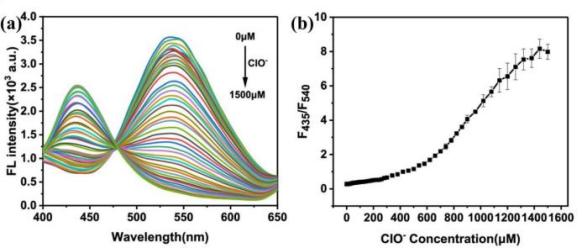
| ClO⁻ | 3-Aminophenylboronic acid (3-APBA) and glutaric acid | Hydrothermal method | 0.1~1000 | 0.5 | 2 h | Tap water, Drinking water | |
| TC | Citric acid and Urea | microwave-assisted method | 7~100 | 0.48 | 23 min | Tap water, River water, Lake water | |
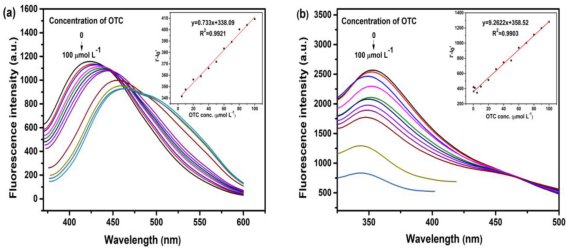
| OTC | ON-CQDs:Orange peel WN-CQDs:Watermelon peel | Hydrothermal method | ON-CQDs: 2~100 WN-CQDs: 0.25~100 | ON-CQDs:0.973 WN-CQDs:0.077 | 20 min | Tap water, Lake water, Soil | |
| 4-NP | Sweet flagdried rhizomes | Microwave irradiation | 0~14.28 | 0.207 | 1 min | Tap water, River water |