| Analyte | Precursors | Synthesis Method | Linear Range (μmol/L) | LOD (μmol/L) | Response Time | Real Sample | Ref |
|---|---|---|---|---|---|---|---|
| Fe3+ | Gallic acid and o-phenylenediamine | Hydrothermal method | 0~50 | 0.8 | 5 min | Tap water, spring water | |
| Cu2+ | Pu-erh tea | Brewing with hot water | 0~170 | 0.051 | 1 h | --- | |
| Al3+ | p-phenylenediamine and toluene | Solvothermal method | 0~35 | 0.09 | 5 min | Tap water, Ultrapure water | |
| Hg2+ | Citric acid and glutathione | Microwave-assisted method | 0.1~90 | 0.041 | 5 min | Tap water, River water, Lake water | |
| Hg2+ | Ascorbic acid and thiourea | Microwave-assisted method | 0.05~7.0 | 0.018 | 5 min | Tap water, River water | |
| Pb2+ | BCDs:Sodium citrate and polyacrylamide RCDs:p-Phenylenediamine and ethanol | Hydrothermal method | 0~0.2 | 2.89×10⁻³ | 5 min | Tap water, Lake water | |
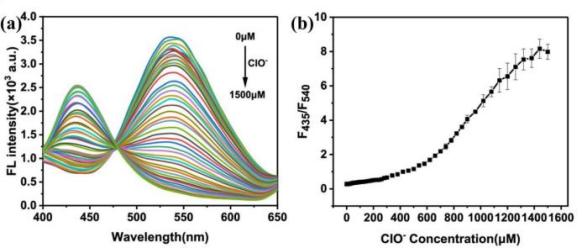
| ClO⁻ | Glutathione | Hydrothermal method | 1~1500 | 0.03654 | 30 s | Tap water, Swimming pool water, Milk | |
| PO43⁻ | GCDs:Perylene-3,4,9,10-tetracarboxylic (PTCDA) and triethylamine (TEA) RCDs:p-phenylenediamine (p-PDA) | Hydrothermal method | 0~55 | 0.09 | 2 min | Tap water, Lake water, Soil extracts | |
| CN⁻ | Citric acid and ethylenediamine anhydrous | Hydrothermal method | 0.008~75 | 0.008 | 10 min | Tap water, Cassava roots, Sprouted potatoes, Liquor | |
| S2⁻ | Citric acid and urea. | Hydrothermal method | 1~50 | 0.35 | 2 min | River water, wastewater | |
| F⁻ | o-Phenylenediamine and citric acid | Hydrothermal method | 0.5~150 | 0.0558 | 1 min | Tap water, Surface water, |