×
模态框(Modal)标题
在这里添加一些文本
Close
Close
Submit
Cancel
Confirm
×
模态框(Modal)标题
×
中文
Progress in Chemistry
About journal
About journal
Editorial board
Ethical statements
Contact
Cooperation
Browse
Current issue
Earlier issues
Special issues
Special topics
Feature section
MiniAccounts
Foot print of Chinese chemistry
Browse by areas
Top downloaded
Top viewed
Top cited
Just accepted
Author center
Instructions authors
Author center
Download center
Manuscript center
Editor login
EiC login
Peer reviewer login
Subscription
Print journal
E-mail Alert
Rss
Feedback
News
中文
Earlier issues
About journal
About journal
Editorial board
Ethical statements
Contact
Cooperation
Browse
Current issue
Earlier issues
Special issues
Special topics
Feature section
MiniAccounts
Foot print of Chinese chemistry
Browse by areas
Top downloaded
Top viewed
Top cited
Just accepted
Author center
Guide for author
Submission now
Download center
Manuscript center
Editor login
EiC login
Peer reviewer login
Subscription
Print journal
E-mail Alert
Rss
Feedback
News
Announcement
More
Figure/Table detail
Experimental Preparation of Borophene and Its Application in Sensors
Shifan Chen, Yi Liu, Xiang Liu, Qian Tian, Guoan Tai
Progress in Chemistry
, 2024, 36(
8
): 1119-1133. DOI:
10.7536/PC240122
Fig. 12
Research prospect in borophene
Other figure/table from this article
Table 1
Characteristics and applications of two-dimensional materials
[
15
⇓
⇓
⇓
⇓
⇓
~
21
]
Fig. 1
Schematic diagram and physical characterization of γ-B
28
borophene: (a) Schematic diagram of preparation and structure of γ-B
28
borophene; (b) AFM images; (c) FFT images; (d) Ultraviolet-visible (UV-Vis) absorption spectrum; (e) Room temperature photoluminescence (PL) spectrum
[
61
]
. Copyright 2015 John Wiley and Sons
Fig. 2
Synthesis of borophene on Ag (111) substrate: (a) Schematic diagram of MBE device for preparing borophene; (b) ~(g) STM image of borophene (left) and closed-loop dI/dV (right)
[
71
]
. Copyright 2015 Science
Fig. 3
Crystal structure of borophene on mica substrates: (a) Atomic structure diagram of borophene and mica; (b) Structure of α′-2H borophene; (c) AFM image of borophene; (d) HRTEM image of borophene; (e) TEM image of borophene. Corresponding SAED images are shown as insets
[
80
]
. Copyright 2021 ACS Publications
Fig. 4
Typical TEM images of few-layer B nanosheets prepared by 4 h tip ultrasonication in DMF (a, b) and IPA (c, d), followed by centrifugation at 5000 r/min for 30 min. The insets in (a), (c), and (d) display the corresponding FFT patterns of the selected regions
[
81
]
.Copyright 2018 ACS Publications
Fig. 5
Synthesis of αʹ-4H-borophene by in-situ thermal decomposition: (a) SEM image; (b) Statistical data of lateral dimensions of 80 nanosheets measured by SEM; (c) AFM image; (d) Low-resolution TEM image; (e) HRTEM image and corresponding SAED pattern; (f) Reconstructed HRTEM image of the FFT pattern extracted from the red rectangular region in (e)
[
83
]
. Copyright 2020 John Wiley and Sons
Fig. 6
Morphology and crystallinity of borophene-graphene heterostructures: (a~c) SEM images of few-layer graphene, borophene, and borophene-graphene heterostructure; (d) Low-resolution TEM image of a typical borophene-graphene heterostructure; (e) Low-resolution TEM image of borophene; (f) HRTEM image extracted from the green rectangular region in (e). Insets show the corresponding SAED patterns and HRTEM images obtained from computational models; (g~i) STEM-HAADF-EDS elemental mapping of the borophene-graphene heterostructure
[
85
]
. Copyright 2020 Springer Nature
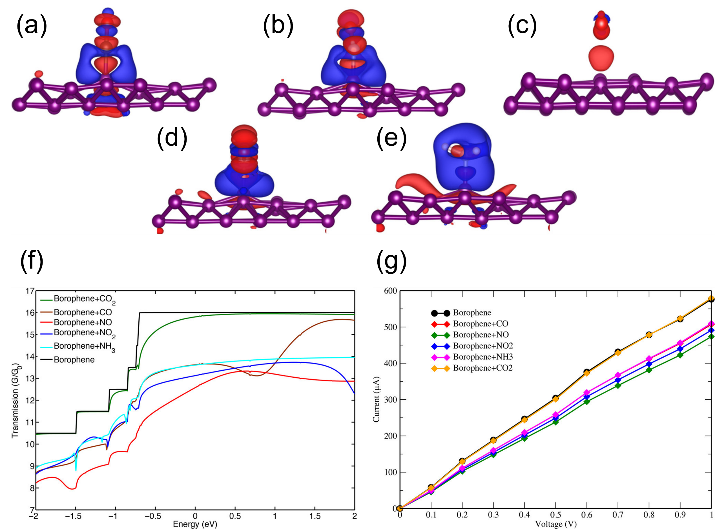
Fig. 7
(a~e) Charge density difference maps of gas adsorption (CO, NO, CO
2
, NO
2
, NH
3
) on the surface of borophene. Red surfaces indicate electron gain, while blue surfaces indicate electron loss; (f) Zero-bias transmission of pristine borophene and borophene+gas system; (g) I-V characteristics of monolayer borophene with different adsorbed gas molecules
[
86
]
.Copyright 2017 ACS Publications
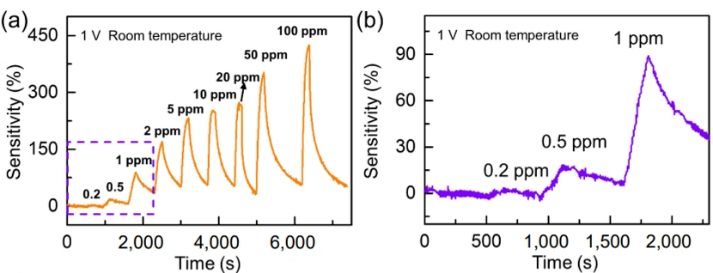
Fig. 8
Borophene gas sensor: (a) Response curve at different NO
2
concentrations; (b) Response curve at low NO
2
concentration
[
92
]
. Copyright 2021 Springer Nature
Table 2
Gas sensing performances of some typical two- dimensional gas sensing materials
[
87
⇓
⇓
⇓
⇓
~
92
]
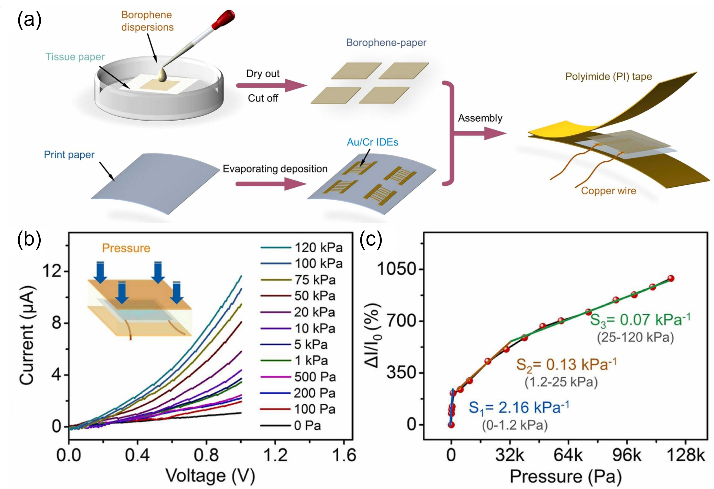
Fig. 9
Borophene pressure sensor: (a) Process flowchart for manufacturing the borophene pressure sensor; (b) Response characteristics of the sensor under static pressure; (c) Sensitivity of the sensor
[
93
]
. Copyright 2022 Elsevier
Fig. 10
Borophene-graphene heterostructure humidity sensor: (a) Schematic representation of the sensor based on borophene-graphene heterostructure; (b) Humidity sensing behavior of the heterostructure sensor at different relative humidities; (c) Sensitivity of the heterostructure sensor exposed to different relative humidities; (d) Response and recovery curves of the heterostructure sensor under 85% RH; (e) Schematic diagram of the bent heterostructure sensor on a PET substrate; (f) Response curves of the sensor with and without applied bending strain
[
85
]
. Copyright 2020 Springer Nature
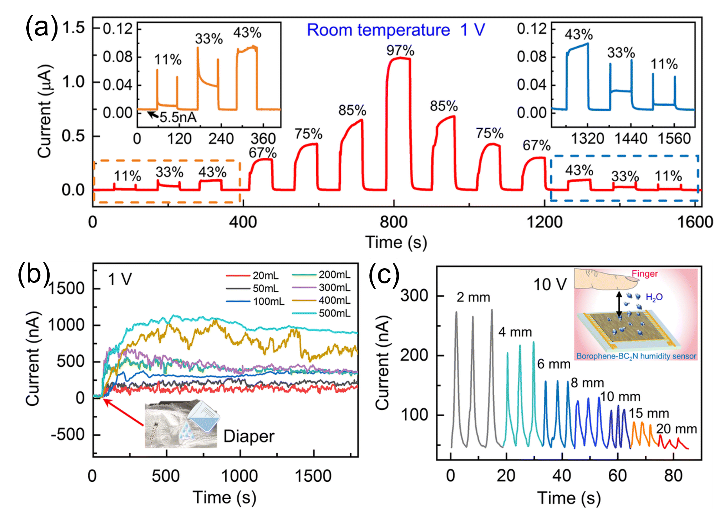
Fig. 11
Borophene-BC
2
N heterostructure humidity sensor: (a) Real-time response of the sensor at different humidity levels; (b) Long-term response of the sensor at different humidity levels; (c) Real-time current curve of the sensor as the fingertip approaches at different distances
[
97
]
. Copyright 2023 RSC Society of Chemistry
Table 3
Humidity sensing performances of some typical two- dimensional material resistive humidity sensors
[
85
,
97
⇓
⇓
⇓
~
101
]