| HER electrocatalyst supported by graphene | Supporting metals | Disperse the cobalt onto nitrogen-doped graphene | 0.5 M H2SO4 | 30 | 147 | 82 | 51 |
| Single-atom Ni catalysts anchored to nanoporous graphene | 0.5 M H2SO4 | 50 | — | 45 | 24 |
| Mo2TiC2 MXene nanosheets with Ni single atoms loaded on the Mo vacancy sites | 0.5 M H2SO4 | — | 78 | 56.7 | 85 |
| MoS2/graphene composite catalyst | 0.5 M H2SO4 | 100 | 183 | 43.3 | 86 |
| MoS2+graphene mixture | 201 | 365 | 57.5 |
| Pure MoS2 | 293 | >400 | 114.4 |
| Supporting nonprecious metal compounds | Vertical MoS2 nanosheets on graphene | 0.5 M H2SO4 | 188 | — | 84 | 27 |
| MoSe2/rGO hybrid nanostructures | 0.5 M H2SO4 | 125 | 195 | 67 | 33 |
| MoSe2 | 223 | 390 | 103 |
| N,S co-doped carbon dots intercalated few-layer MoS2/graphene nanosheets | 0.5 M H2SO4 | 37 | 98 | 53 | 87 |
| Catalytically activated-graphene based HER electrocatalyst | Doping-induced electrocatalytic activity | S,N-doped graphene | 0.5 M H2SO4 | — | 280 | 80.5 | 10 |
| B-substituted graphene | 0.5 M H2SO4 | 200 | 440 | 99 | 47 |
| Defective graphene | 300 | — | 130 |
| N-doped mesoporous graphene | 0.5 M H2SO4 | — | 239 | 109 | 48 |
| Ni heterolayer N-doped graphene composite MoS2 | 0.5 M H2SO4 | 60 | 270 | 56 | 57 |
| Nickel heterolayer MoS2 | 285 | 460 | 78 |
| Graphene based six membered C-ring dual N-doping | 0.5 M H2SO4 | — | 57 | 44.6 | 58 |
| Ultrafine cobalt-ruthenium alloy on nitrogen and phosphorus co-doped graphene | 0.5 M H2SO4 | — | 52 | 38 | 88 |
| Strain-induced electrocatalytic activity | Mechanical strain and interfacial-chemical interaction for 1T Co-doped WSe2/carbon nanotubes | 0.5 M H2SO4 | — | 147 | 33 | 89 |
| Tuning surface lattice strain towards CoPt2/C truncated octahedron | 0.5 M H2SO4 | — | 17 | 35 | 90 |
| Defect-induced electrocatalytic activity | Double defect N-doped graphene | 0.5 M H2SO4 | — | 245 | 141 | 91 |
| Single atom S vacancy defect WS2 nanosheets | 0.5 M H2SO4 | — | 137 | 53.9 | 92 |
| Single atom S vacancy defect WS2 nanosheets loaded on defective graphene | — | 108 | 48.3 |
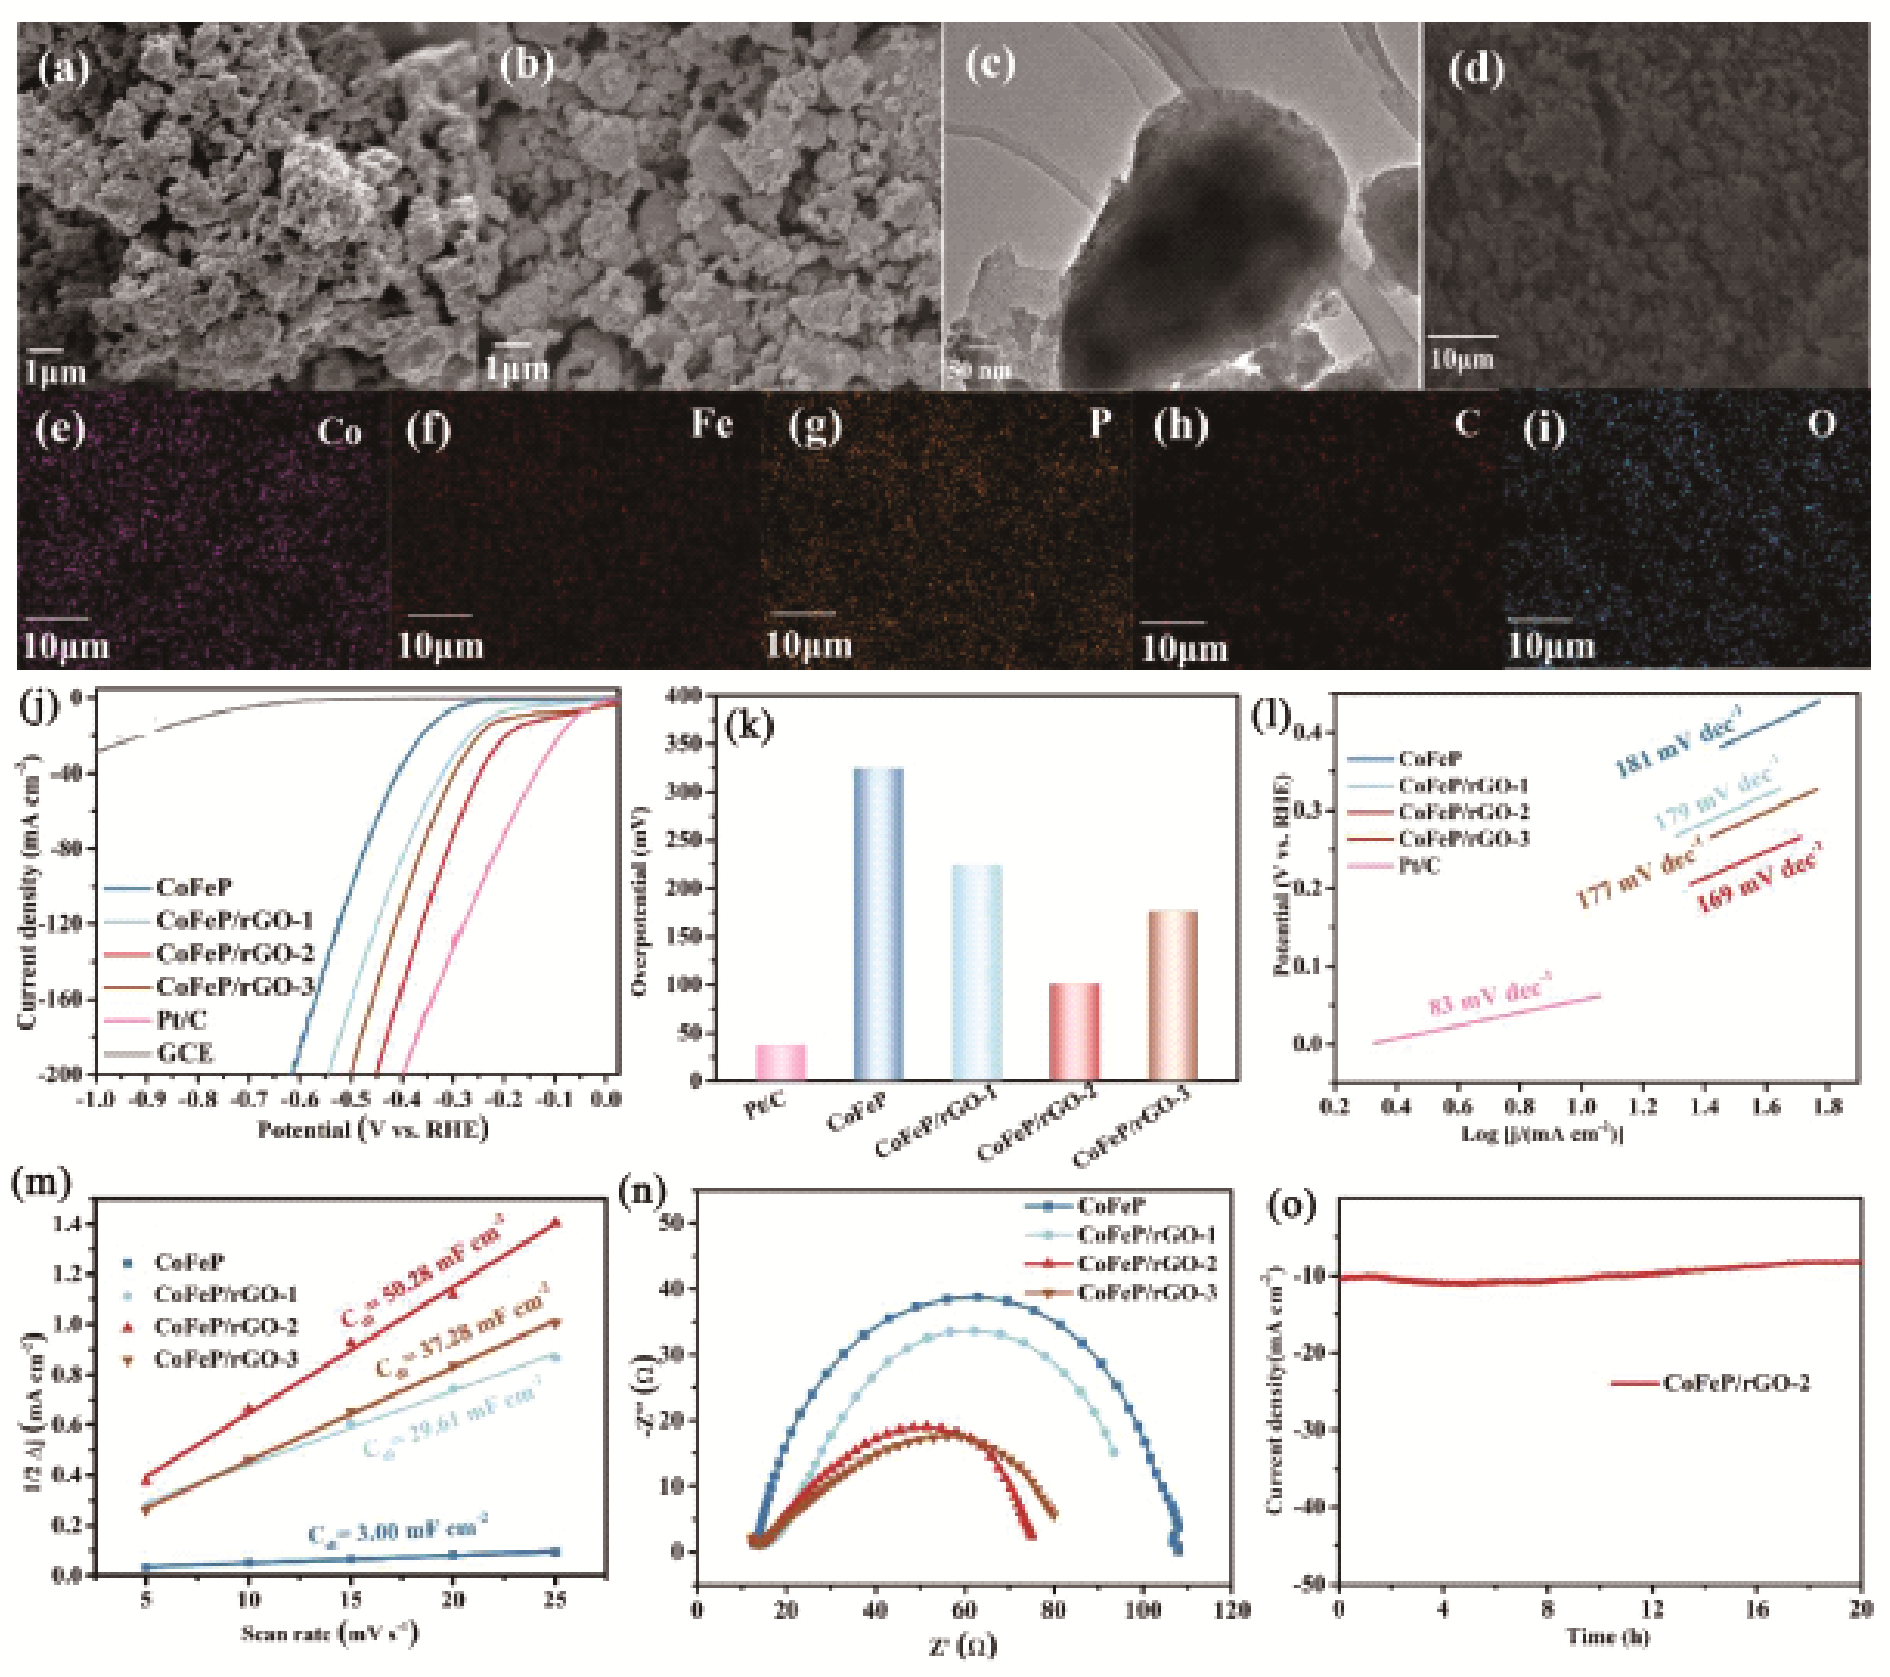
| Heterogeneous graphene-based HER electrocatalyst | CoFeP/graphene heterostructure | 0.5 M H2SO4 | — | 76 | — | 67 |
| graphene /CoMo3S13 sulfur gel heterostructure | 0.5 M H2SO4 | — | 130 | 40.1 | 68 |
| MoS2/ graphene heterostructure | 0.5 M H2SO4 | — | 120 | 72 | 69 |
| Graphene with different morphologies based-HER electrocatalyst | Zero-dimensional graphene | Coral-shaped MoS2 decorated with graphene quantum dots | 0.5 M H2SO4 | 95 | 120 | 40 | 75 |
| Coral-shaped MoS2 | 124 | 173 | 63 |
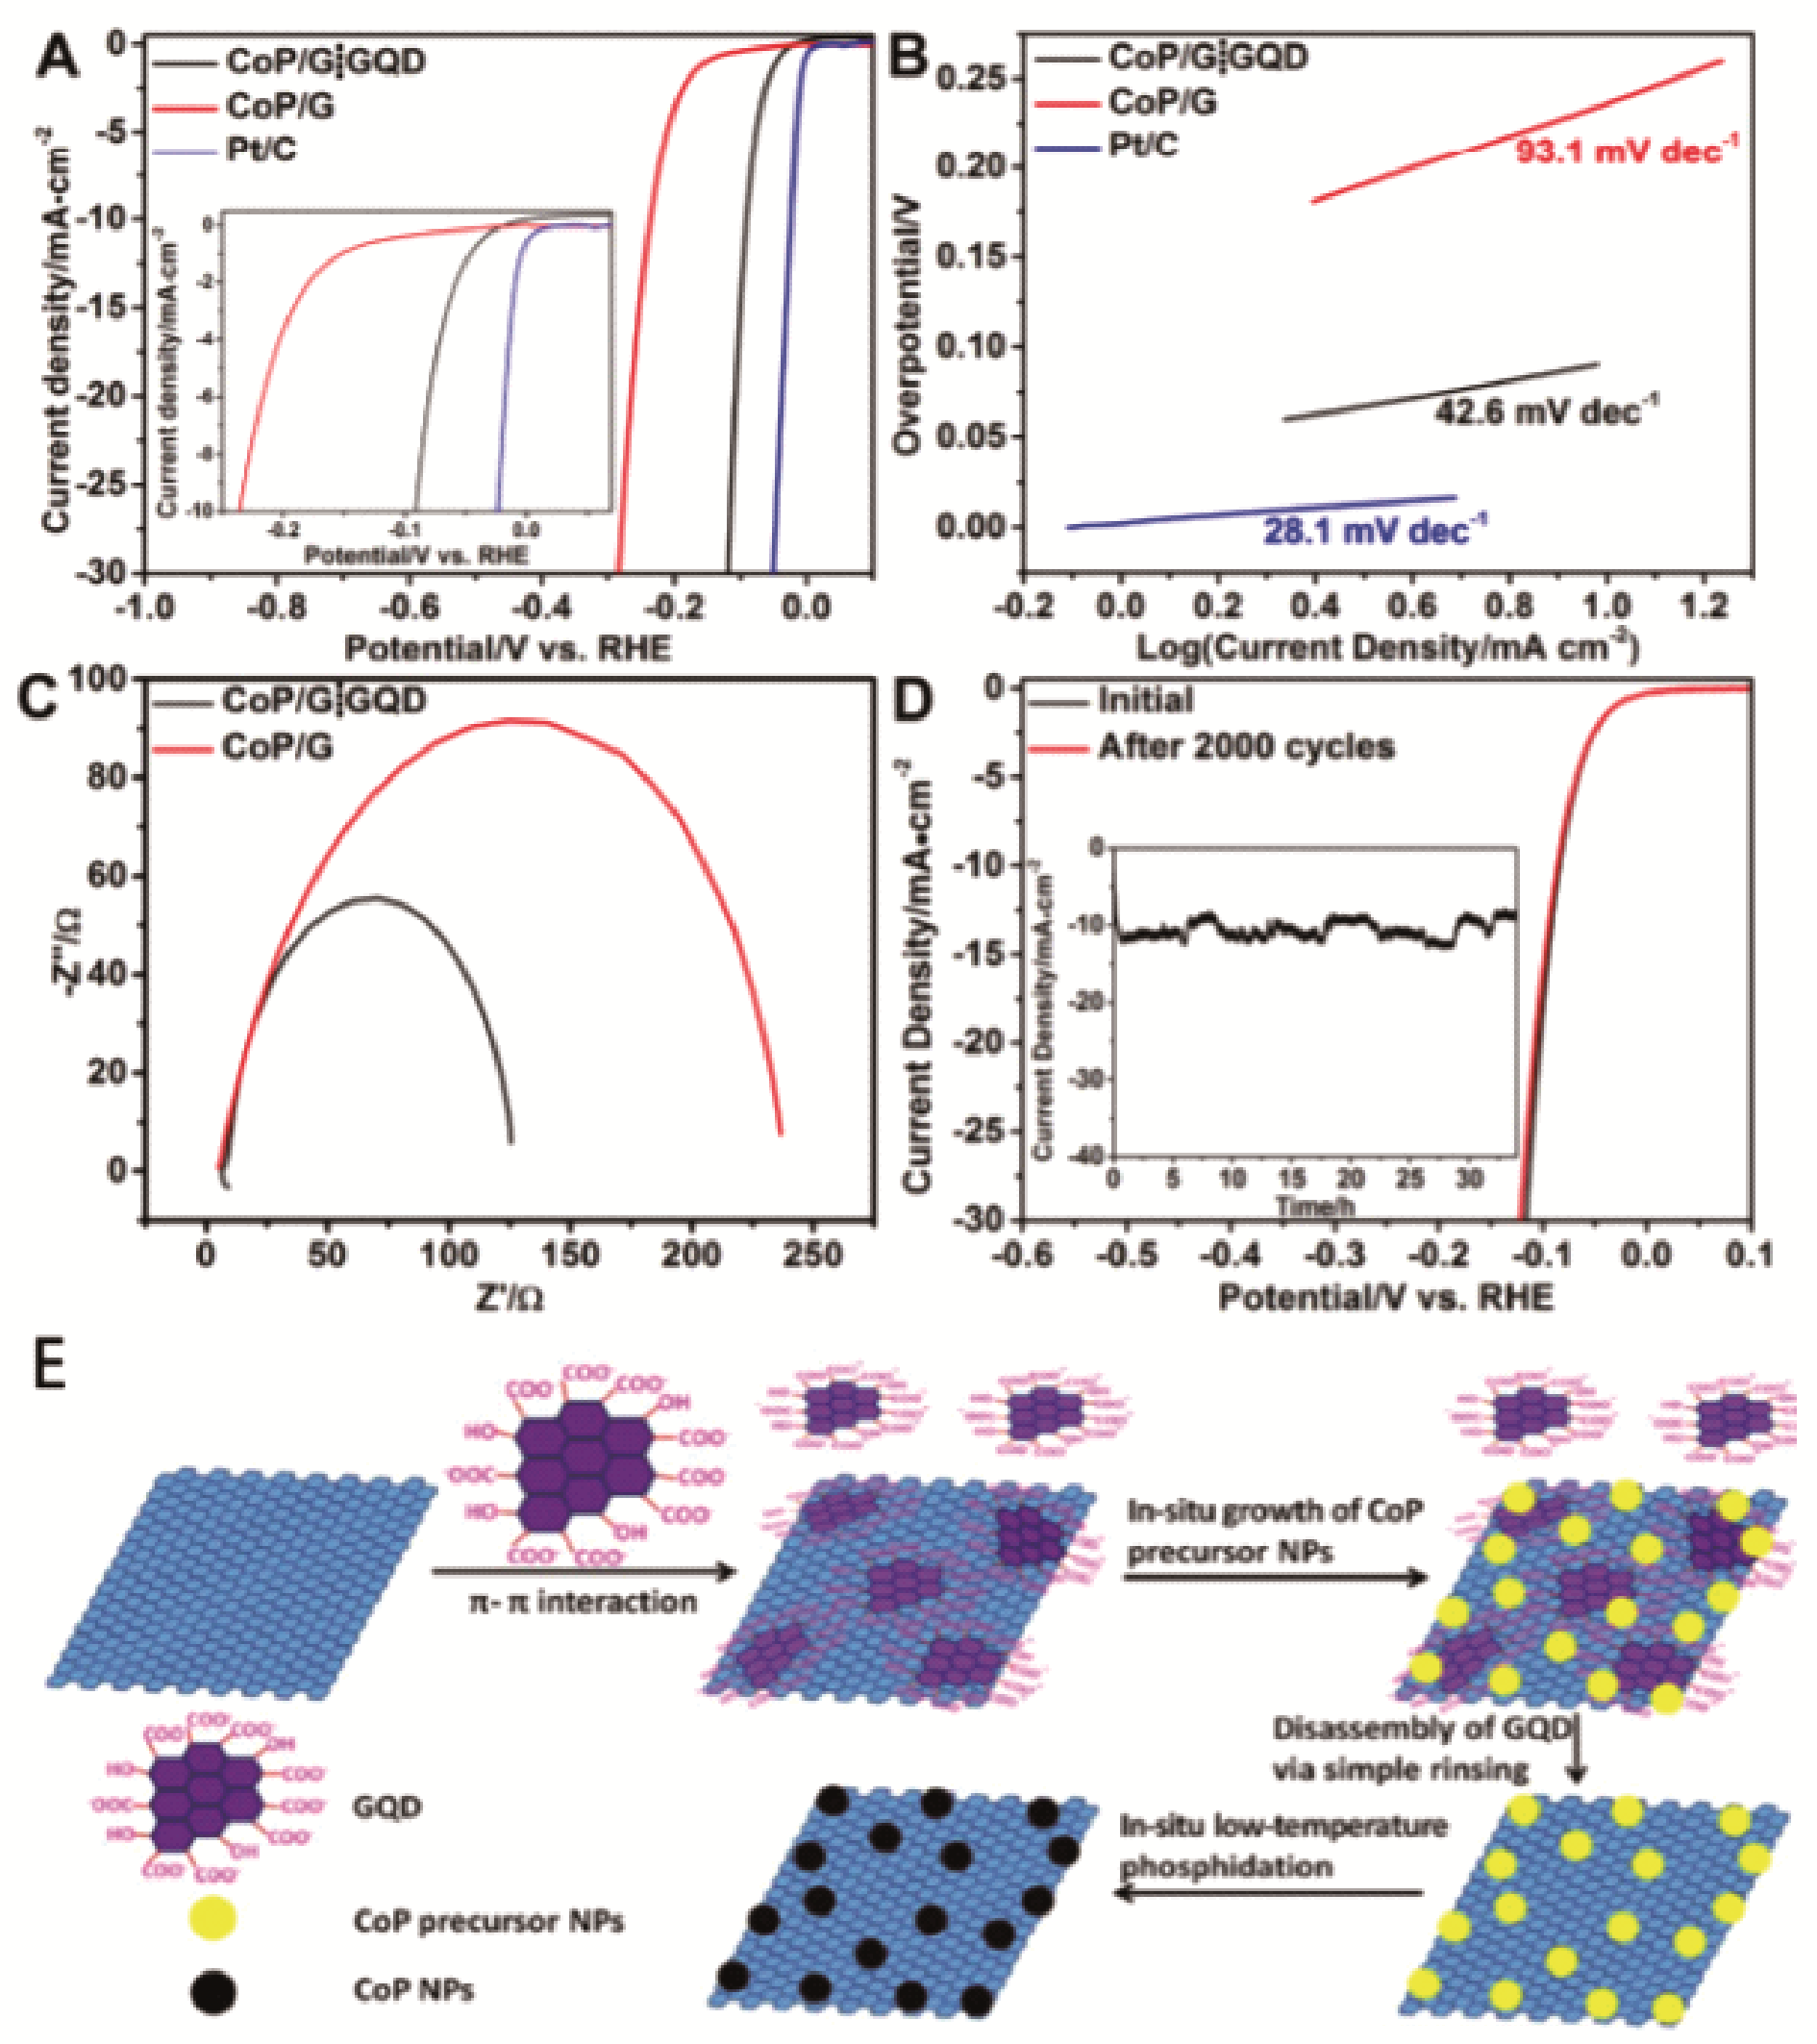
| Synthesis of CoP nanoparticles supported on pristine graphene by graphene quantum dots | 0.5 M H2SO4 | 7 | 91.3 | 42.6 | 77 |
| CoP nanoparticles supported on pristine graphene | 118.9 | 156.89 | 70.22 |
| graphene quantum dots /MoS2 microsheets | 0.5 M H2SO4 | — | 160 | 56.9 | 93 |
| MoS2 microsheets | — | 340 | 93.6 |
| Ultrafine graphene like C3N4 quantum dots | 0.5 M H2SO4 | — | 208 | 52 | 94 |
| Three-dimensional skeleton graphene | loading of vertical graphene sheets on SiOx nanowires | 0.5 M H2SO4 | 18 | 107 | 64 | 78 |
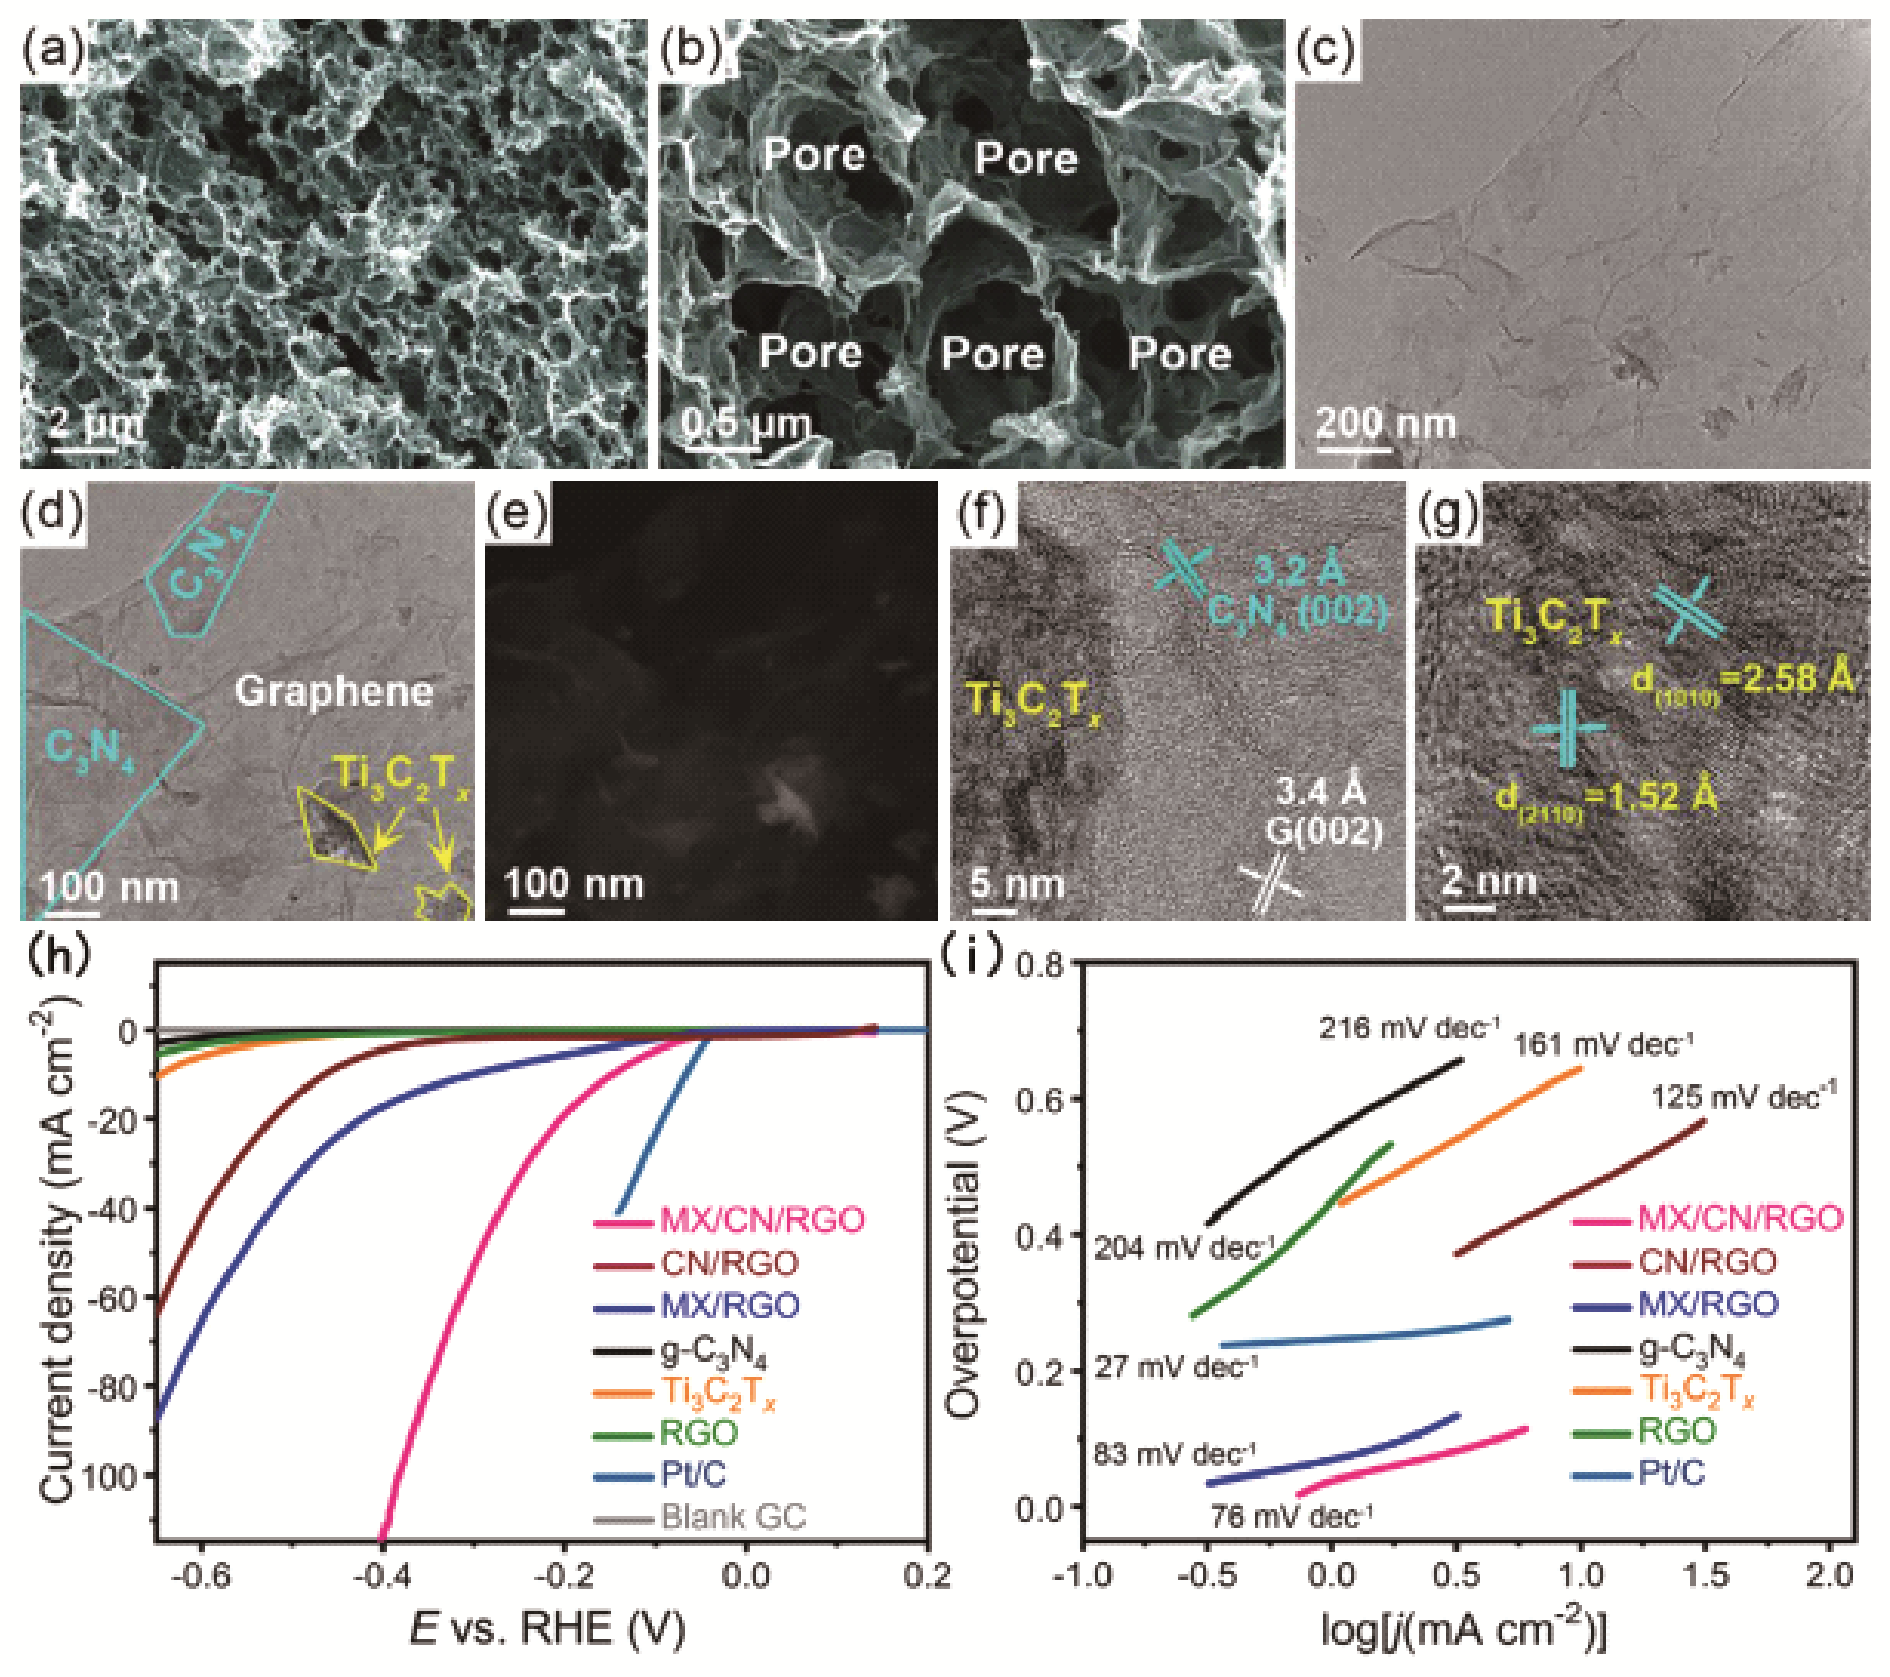
| 3D interweaved MXene/graphitic carbon nitride nanosheets/graphene nanoarchitectures | 0.5 M H2SO4 | 38 | — | 76 | 82 |
| Three-dimensional foliated MoS2/rGO composite aerogel | 0.5 M H2SO4 | 105 | — | 51 | 95 |
| MoS2 | 216 | — | 89 |
| Encapsulated graphene | Ultrathin graphene shell encapsulated CoNi nanoalloy | 0.5 M H2SO4 | Almost 0 | 142 | 104 | 83 |
| N-doped graphene encapsulated Ni3Cu1 nanoflower | 0.5 M H2SO4 | — | 95 | 77.1 | 84 |
| N-doped carbon encapsulated CoP nanoparticles | 0.5 M H2SO4 | — | 135 | 59.3 | 96 |
| CoP | — | 231 | 85.8 |