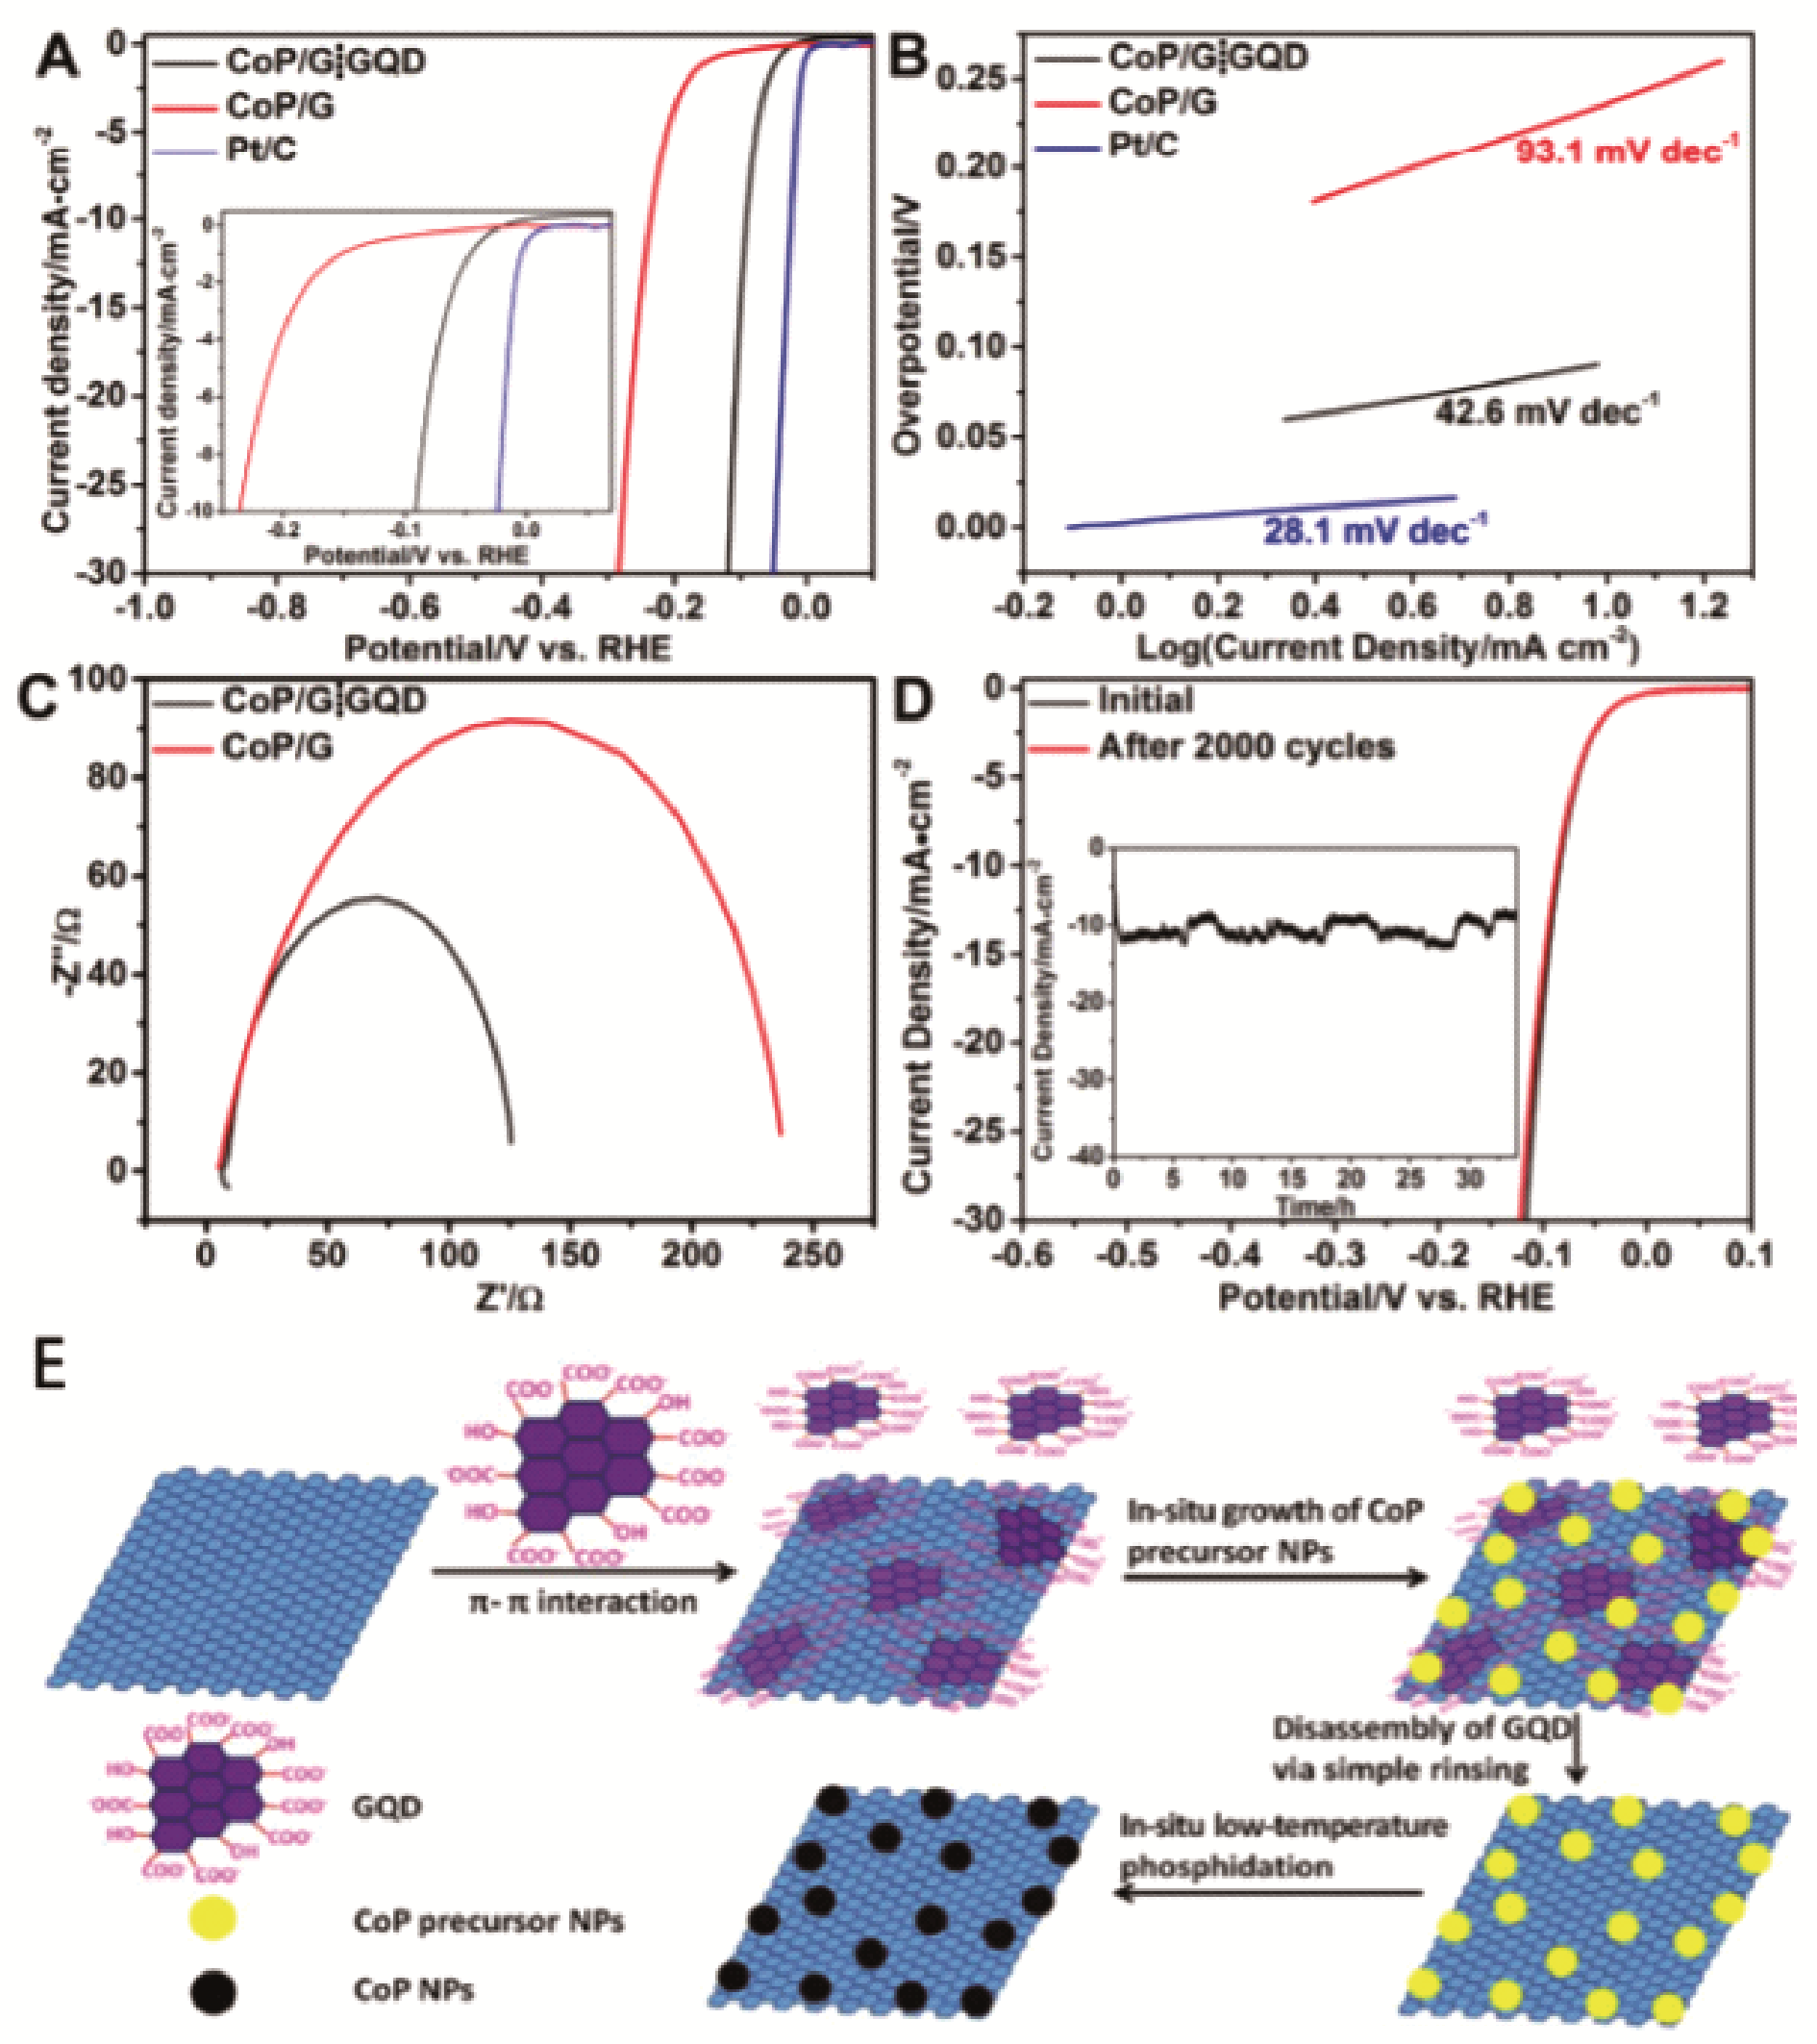
Fig. 6 LSV curves (A) and Tafel plots (B) of CoP/G⁞GQD, CoP/G, and commercial Pt/C; (C) Nyquist plots of CoP/G⁞GQD and CoP/G measured at an overpotential of 200 mV in a frequency range from 106 to 1 Hz; (D) LSV curves of CoP/G⁞GQD at a scan rate of 2 mV/s before and after 2000 CV cycles at a scan rate of 100 mV/s between -0.17 and +0.01 V. Inset: time dependence of the current density of CoP/ G⁞GQD at an overpotential of 91.3 mV; (E) schematic illustration of the synthesis process of CoP/G⁞GQD[77]
Other figure/table from this article