×
模态框(Modal)标题
在这里添加一些文本
Close
Close
Submit
Cancel
Confirm
×
模态框(Modal)标题
×
中文
Progress in Chemistry
About journal
About journal
Editorial board
Ethical statements
Contact
Cooperation
Browse
Current issue
Earlier issues
Special issues
Special topics
Feature section
MiniAccounts
Foot print of Chinese chemistry
Browse by areas
Top downloaded
Top viewed
Top cited
Just accepted
Author center
Instructions authors
Author center
Download center
Manuscript center
Editor login
EiC login
Peer reviewer login
Subscription
Print journal
E-mail Alert
Rss
Feedback
News
中文
Earlier issues
About journal
About journal
Editorial board
Ethical statements
Contact
Cooperation
Browse
Current issue
Earlier issues
Special issues
Special topics
Feature section
MiniAccounts
Foot print of Chinese chemistry
Browse by areas
Top downloaded
Top viewed
Top cited
Just accepted
Author center
Guide for author
Submission now
Download center
Manuscript center
Editor login
EiC login
Peer reviewer login
Subscription
Print journal
E-mail Alert
Rss
Feedback
News
Announcement
More
Figure/Table detail
Applications of Graphene in Hydrogen Evolution Electrocatalyst
Yiming Zhang, Jianping Guo, Jiale Zhang, Aowen Zheng, Yanyan Wang, Guangke Tian
Progress in Chemistry
, 2024, 36(
5
): 633-644. DOI:
10.7536/PC230905
Fig. 1
Number of SCI papers related to graphene-based hydrogen evolution electrocatalytic materials published from 2018 to 2022
Other figure/table from this article
Fig. 2
(A) Schematic illustration of the proposed mechanism for the formation of Pt-CNSs/rGO nanohybrids. (B) TEM image of Pt-CNSs, insets: (a) HRTEM image and (b) FFT pattern of Pt-CNSs. (C) Typical TEM images of Pt-CNSs/rGO nanohybrids. (D) HER polarization curves of Pt-CNSs/rGO nanohybrids and Pt-CNSs in N
2
-saturated 0.5 M H
2
SO
4
solution at a scan rate of 5 mV/s and rotation rate of 1000 r/min. The top-right inset shows the corresponding Tafel plots for Pt-CNSs/rGO nanohybrids and Pt-CNSs. (E) Electrochemical impedance spectra of Pt-CNSs/rGO nanohybrids and Pt-CNSs
[
17
]
Fig. 3
(A) Schematic solvothermal synthesis with GO sheets to afford the MoS
2
/rGO hybrid. (B) SEM and (inset) TEM images of the MoS
2
/RGO hybrid. (C) Schematic solvothermal synthesis without any GO sheets, resulting in large, free MoS
2
particles. (D) SEM and (inset) TEM images of the free particles. (E) TEM image showing folded edges of MoS
2
particles on RGO in the hybrid. The inset shows a magnified image of the folded edge of a MoS
2
nanoparticle. (F) HRTEM image showing nanosized MoS
2
with highly exposed edges stacked on a RGO sheet. Polarization curves (G) and corresponding Tafel plots (H) of different electrocatalysts
[
26
]
Fig. 4
Low magnification TEM images of N, S co-doped graphene (NSG) (a) and plasma-etched N, S co-doped graphene (P-NSG) (b); high magnification TEM images of NSG (c) and P-NSG (d); SAED patterns of NSG (e) and P-NSG (f); (g) schematic illustration of the synthesis process of P-NSG
[
44
]
Fig. 5
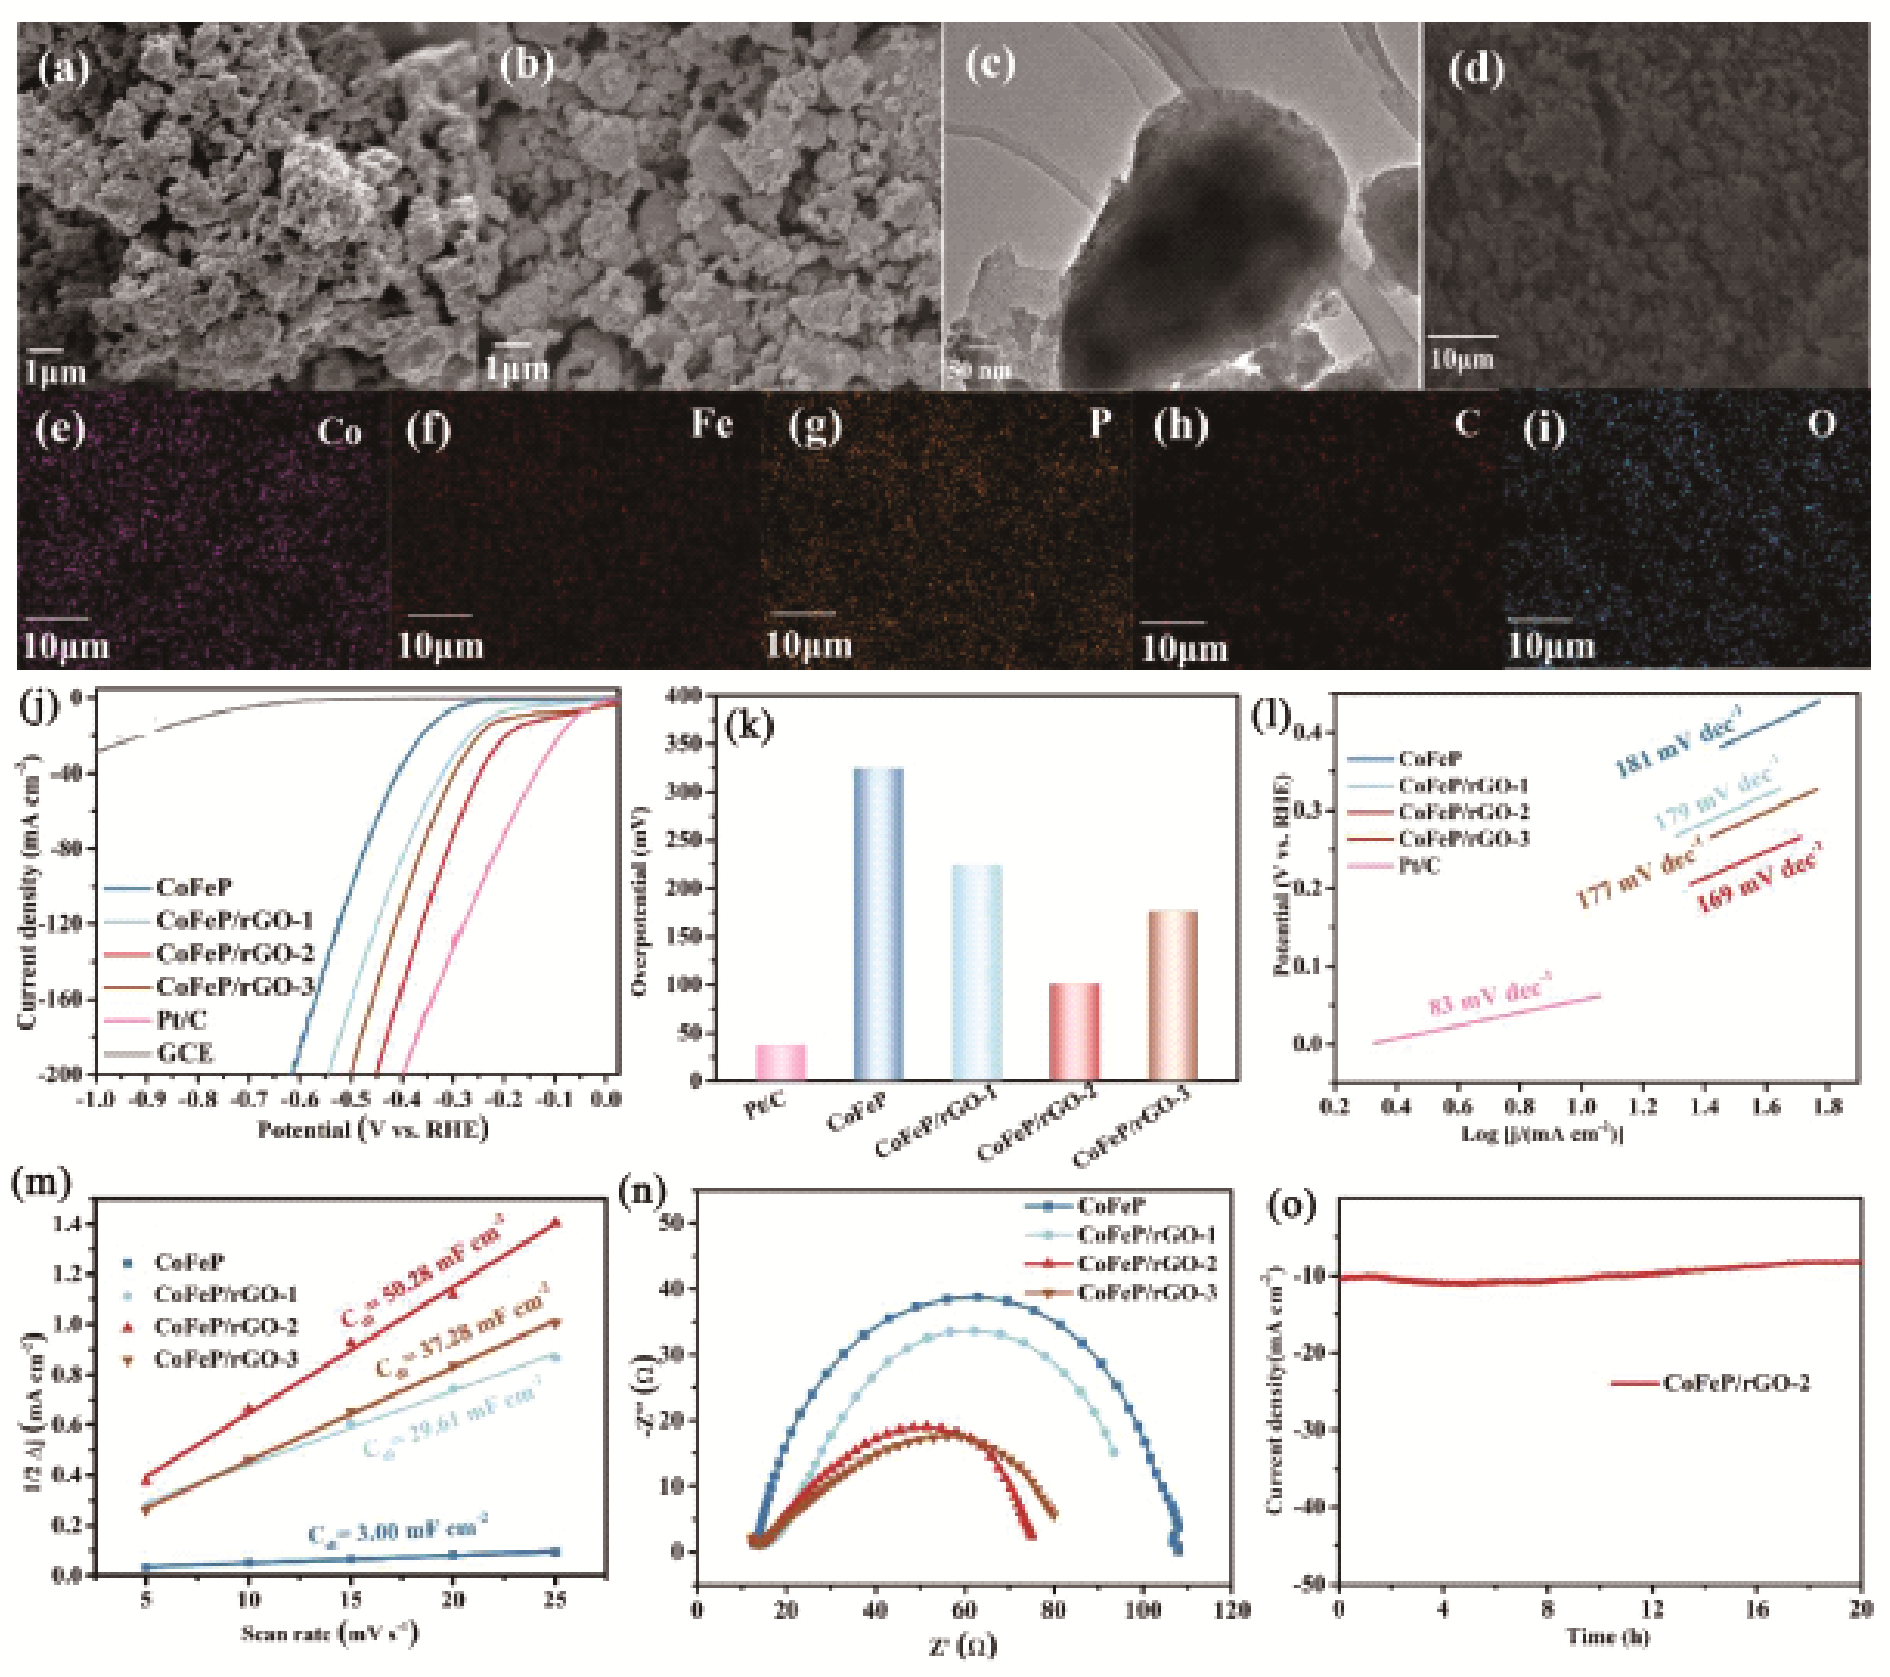
SEM images of (a) CoFeP and (b) CoFeP/rGO, (d) TEM image and corresponding elemental mapping images (e~i) of CoFeP/rGO. HER performance of CoFeP and CoFeP/rGO composites in the 0.5 M H
2
SO
4
solution: (j) HER polarization curves; (k) Overpotentials; (l) Tafel plots; (m) Capacitive current densities; (n) Nyquist plots; (o) i-t curves of CoFeP/rGO at potential of 0.076 V vs RHE
[
67
]
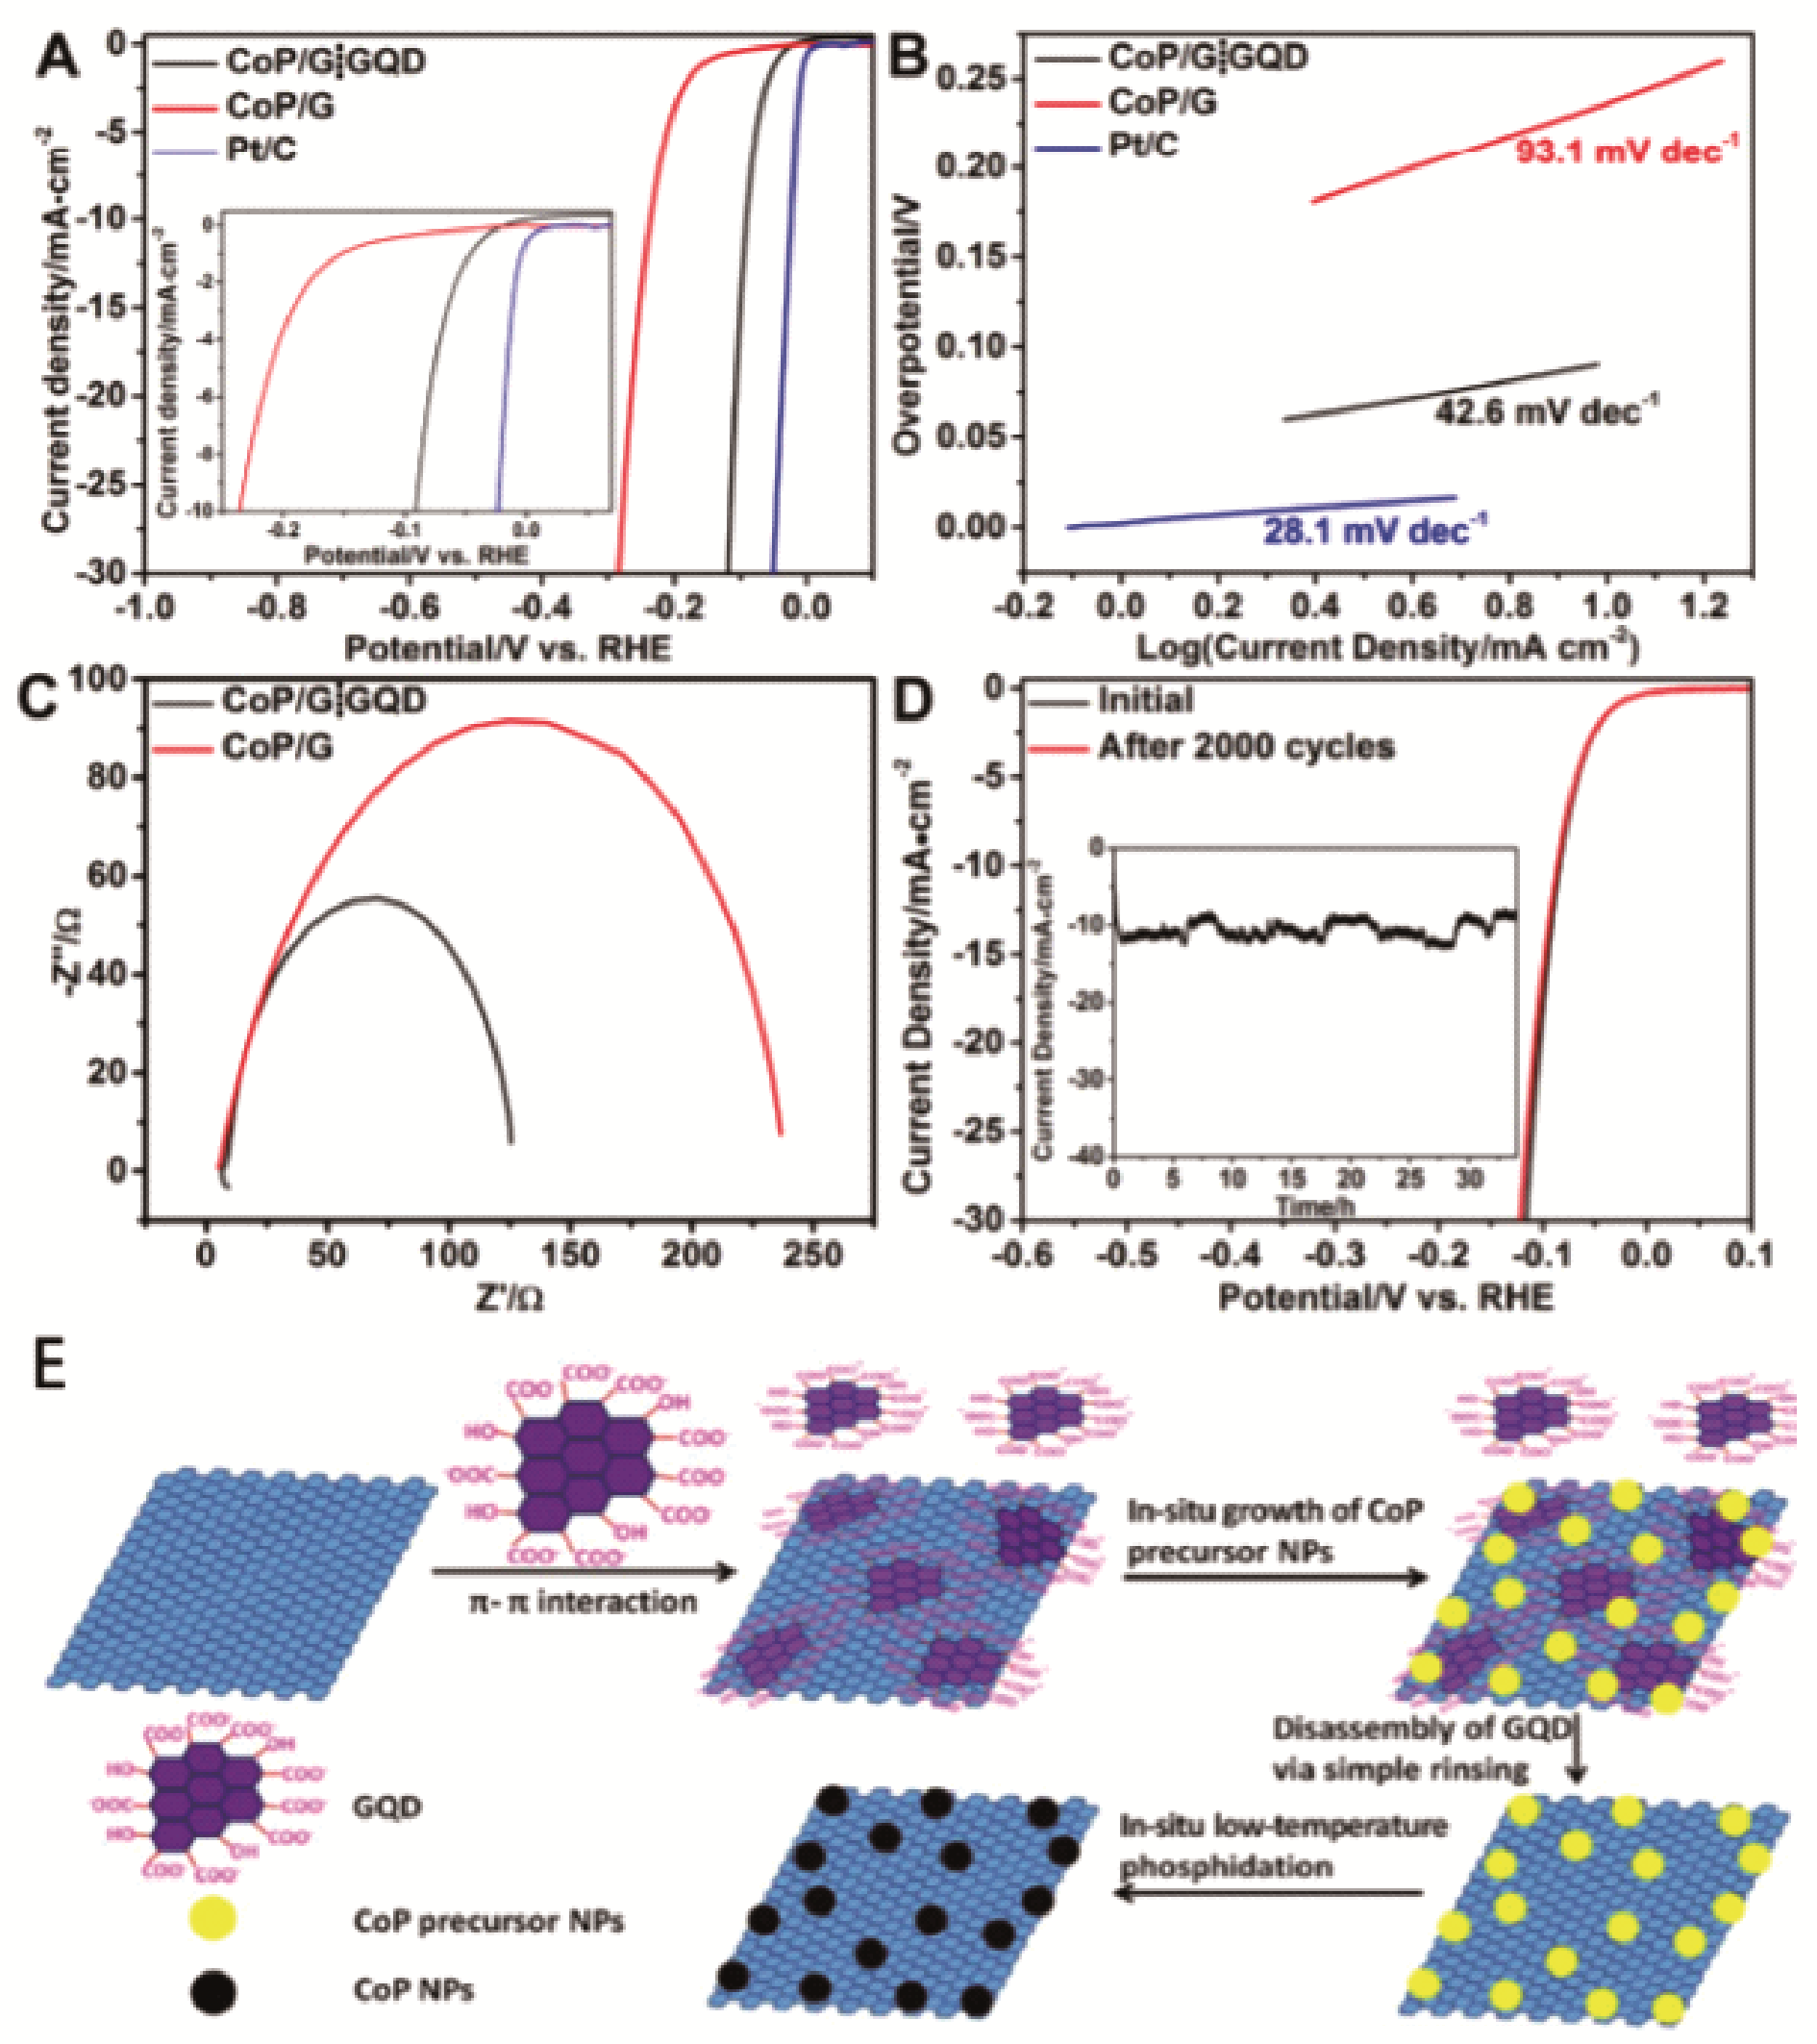
Fig. 6
LSV curves (A) and Tafel plots (B) of CoP/G⁞GQD, CoP/G, and commercial Pt/C; (C) Nyquist plots of CoP/G⁞GQD and CoP/G measured at an overpotential of 200 mV in a frequency range from 10
6
to 1 Hz; (D) LSV curves of CoP/G⁞GQD at a scan rate of 2 mV/s before and after 2000 CV cycles at a scan rate of 100 mV/s between -0.17 and +0.01 V. Inset: time dependence of the current density of CoP/ G⁞GQD at an overpotential of 91.3 mV; (E) schematic illustration of the synthesis process of CoP/G⁞GQD
[
77
]
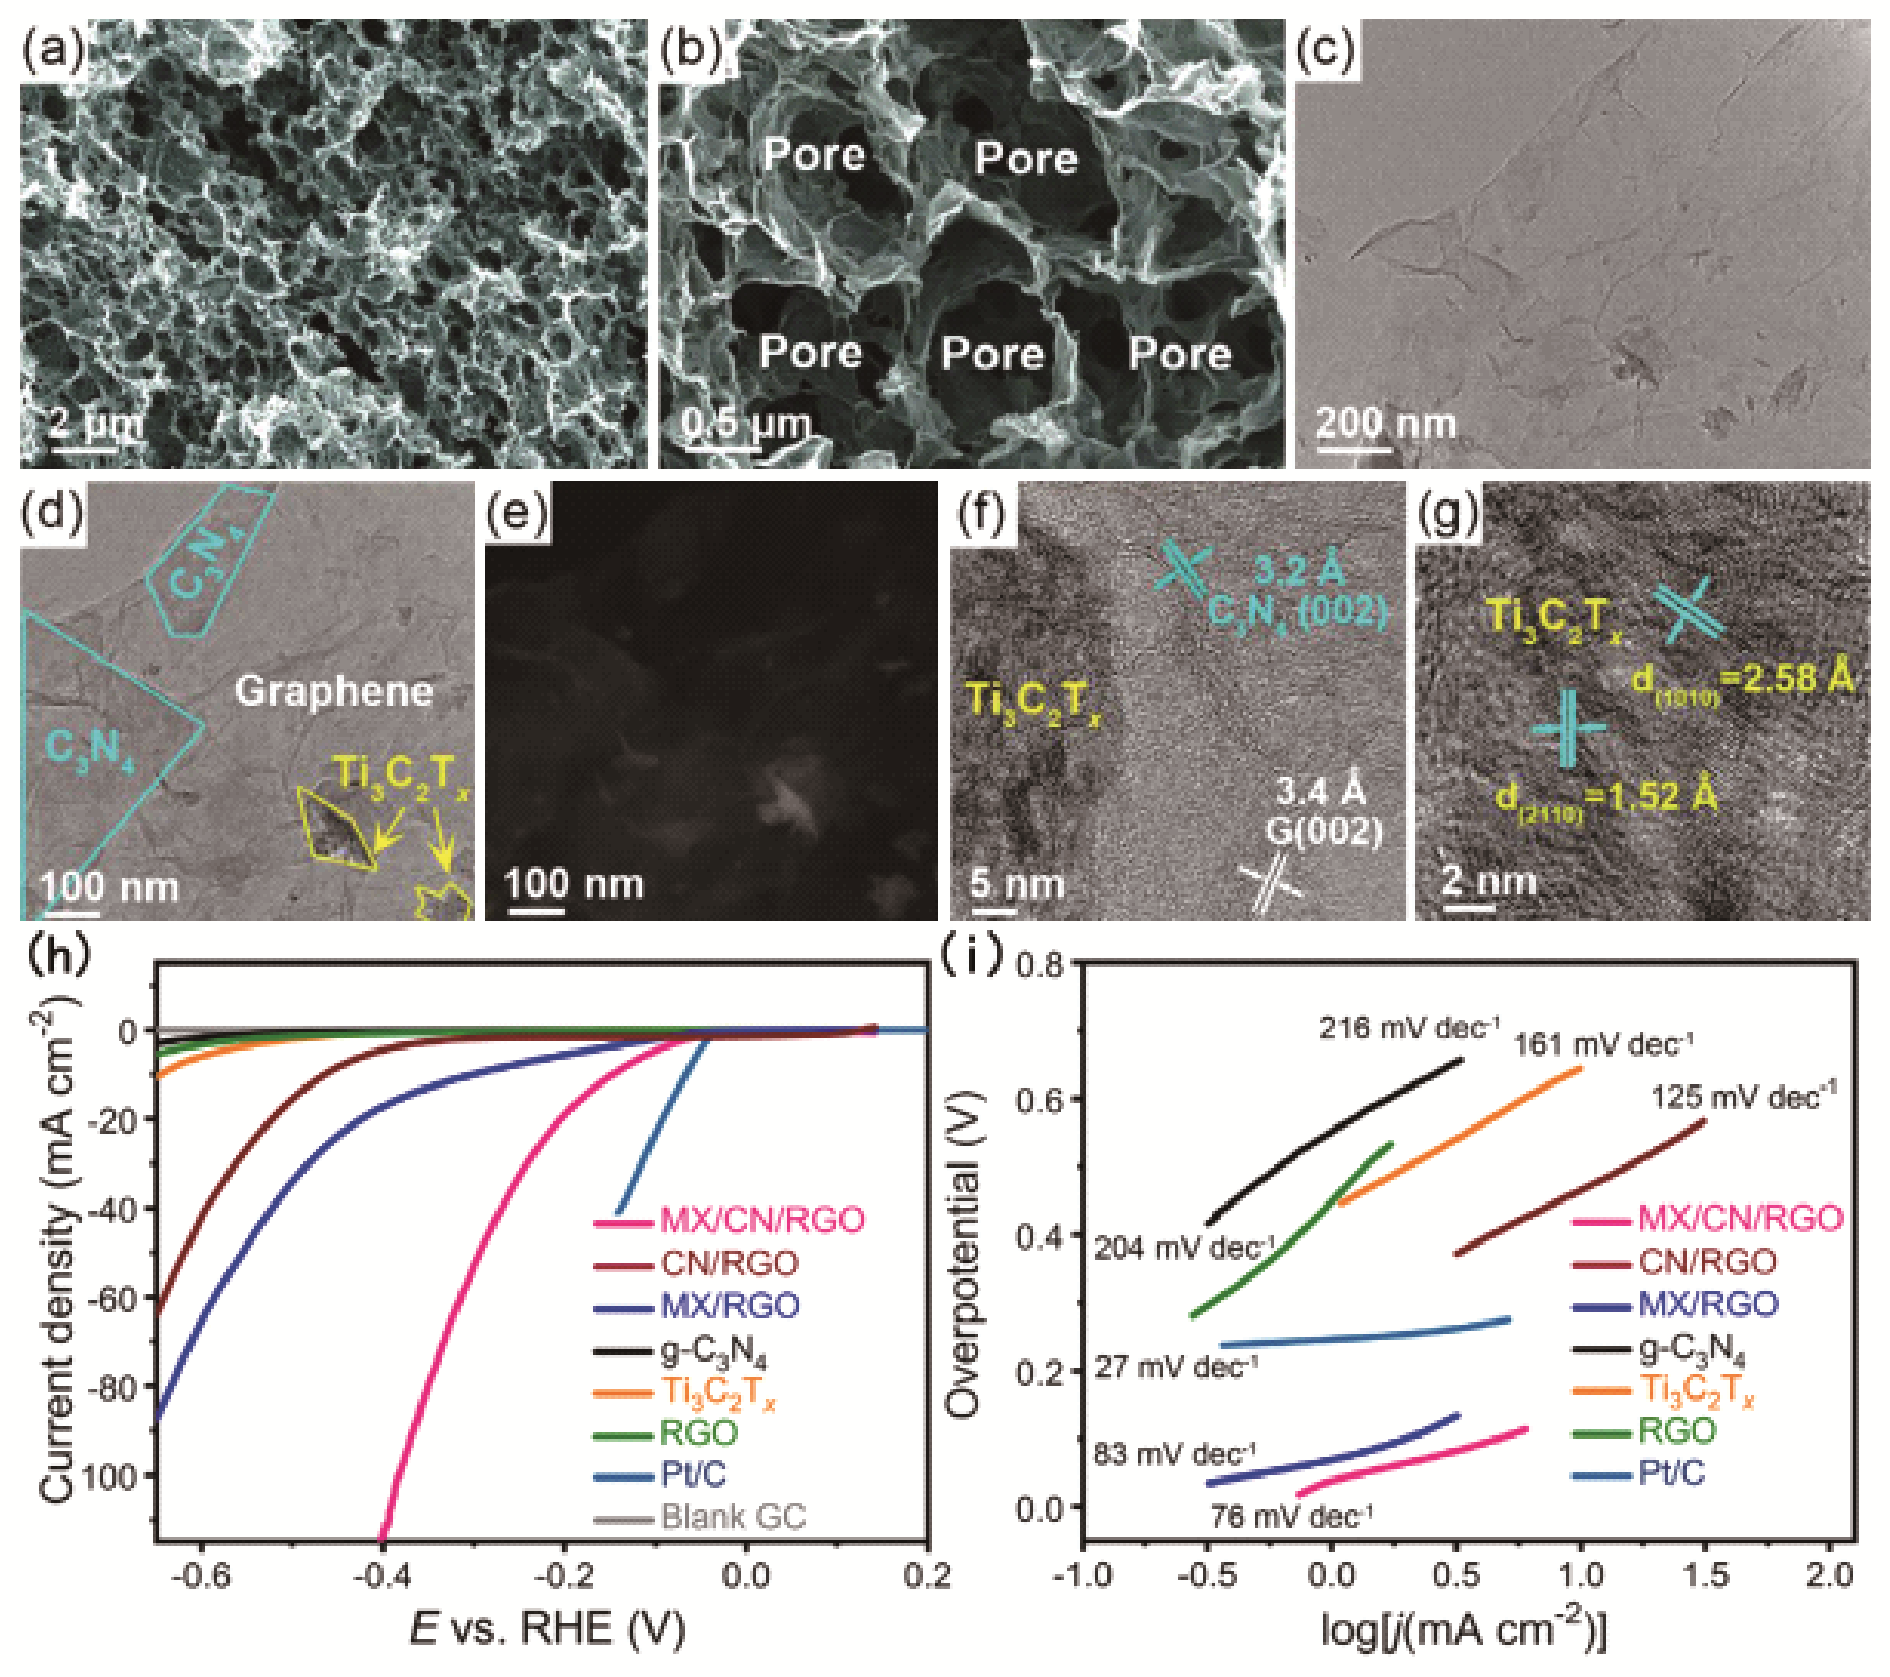
Fig. 7
Morphological and microstructural analysisof the 3D MX/CN/RGO nanoarchitecture. Representative (a, b) FE-SEM, (c, d) TEM, (e) HAADF-STEM images reveal the successful integration of Ti
3
C
2
T
x
, g-C
3
N
4
nanosheets and graphene into a 3D interconnected framework; (f, g) HR-TEM images disclose the lattice fringes of Ti
3
C
2
T
x
and g-C
3
N
4
nanosheets; (h) LSV polarization curves and (i) the corresponding Tafel plots
[
82
]
Fig. 8
(a, b) HRTEM images of CoNi@NC, showing the graphene shells and encapsulated metal nanoparticles. (c) Schematic illustration of the CoNi@NC structure. (d) Statistical analysis of the number of layers in the graphene shells encapsulating the metal nanoparticles in CoNi@NC. (e~h) HAADF-STEM image and corresponding elemental mapping images of CoNi@NC. (i) Gibbs free energy (ΔG) profile of the HER on various catalysts. (j) Volcano plot of the polarized current (i
0
) versus ΔG(H
*
) for a CoNi cluster, CoNi@C, and an N-doped graphene shell (Ncarbon)
[
83
]
Table 1
Summary of the HER performance of some graphene-based electrocatalysts