


1 引言
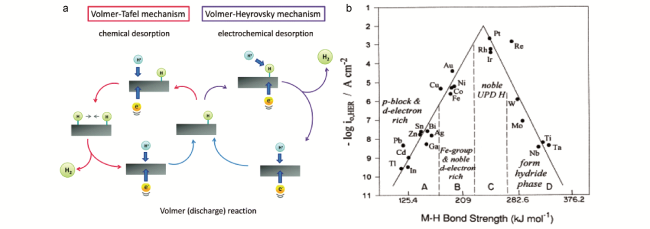
2 电解水析氢简介
3 外场强化电解水析氢
表1 不同外场强化电解水析氢的机理Table 1 The mechanism of hydrogen evolution from water electrolysis enhanced by different external fields |
| Field | Type | Mechanism |
|---|---|---|
| Thermal | Enhanced mass transfer Reduced energy barrier | Reduce charge transfer resistance. Increase the apparent activation energy. Enhance mass transfer in electrolyte. Reduce the bubble coverage on the electrode surface. |
| Magnetic | Enhanced mass transfer | Enhance mass transfer in electrolyte. Reduce the bubble coverage on the electrode surface. |
| Ultrasonic | Enhanced mass transfer | Promote the rapid separation of hydrogen bubbles on the electrode surface. Reduce the bubble coverage on the electrode surface. Enhanced forced convection of electrolyte. |
| Electric | Reduced energy barrier | Adjust the electronic structure of the catalyst. Promote carrier transport. Improve channel conductance. Optimize the hydrogen atom adsorption energy of the catalyst. Promote interfacial charge transfer |
| Gravitational | Enhanced mass transfer | Promote the release of hydrogen bubbles. Reduce the bubble coverage on the electrode surface. |
| Optical | Reduced energy barrier Enhanced residual electric field | Induced polarization of water molecules. Increase the residual electric field. |
3.1 温度场强化
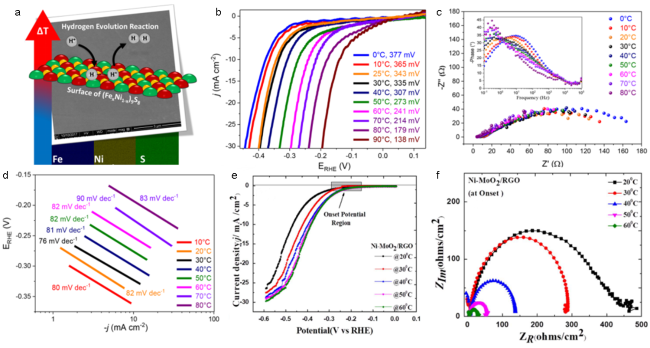
图2 (a)(FexNi1-x)9S8(x= 0~1)催化剂在析氢反应中反应温度对反应效率的影响示意图;(b)不同温度下Fe4.5Ni4.5S8在0.5 M H2SO4中的线性扫描伏安图(图中标明各温度下在10 mA/cm2的过电位);(c)Fe4.5 S8在不同温度下的EIS的Nyquist图和相应的Bode图(插图);(d)在不同温度下的Tafel图[32];(e)在不同温度下的Ni-MoO2/RGO极化曲线;(f)在不同温度下的Ni-MoO2/RGO的Nyquist图[31]Fig.2 (a) The influence of reaction temperature on reaction efficiency of (FexNi1-x) 9S8 (x= 0~1) catalyst in hydrogen evolution reaction. (b) Linear sweep voltammograms of Fe4.5Ni4.5S8 in 0.5 M H2SO4 at different temperatures (The figure shows the overpotential at 10 mA/cm2 at each temperature). (c) Temperature-dependent Nyquist plots of EIS for Fe4.5Ni4.5S8 and corresponding Bode plots (inset). (d) Tafel plot at different temperatures[32]. (e) Polarization curves at different temperatures of Ni-MoO2/RGO. (f) Nyquist curves at different temperatures of Ni-MoO2/RGO[31] |
3.2 磁场强化
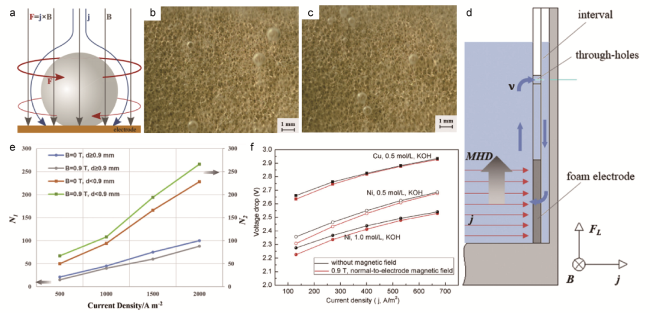
图3 (a)电解产生的气泡附近电磁感应(B)、电流密度(j)及洛伦兹力(F)在电法向磁场中的分布示意图[65];(b)在B = 0 T,j = 1000 A/m2的情况下,铜泡沫电极产生的H2气泡状态;(c)在B = 0.9 T,j = 1000 A/m2的情况下,铜泡沫电极产生的H2气泡状态;(d)由分布不均的洛伦兹力(FL)引起的电解池一侧循环流动(蓝色箭头)示意图;(e)大气泡数(N1,d ≥ 0.9 mm)和小气泡数(N2,d < 0.9 mm)随电流密度的变化曲线[35];(f)电极间电压降与电流密度之比[34]Fig.3 (a) Sketch of the distribution of magnetic induction (B), current density (j), and Lorentz-force (F) in the vicinity of an electrolytic bubble in an electrode-normal magnetic field[65].(b) H2 bubble state produced by copper foam electrode (B = 0 T, j = 1000 A/m2). (c) H2 bubble state produced by copper foam electrode (B = 0.9 T, j = 1000 A/m2). (d) Diagrammatic sketch of the circulating flow (blue arrows) on one side of the electrolyzer, which is caused by the uneven distributed Lorentz force (FL). (e) The curve of the number of larger bubbles (N1, d ≥ 0.9 mm) and smaller bubbles (N2, d < 0.9 mm) with the current density[35]. (f) Voltage drop between electrodes vs. current density[34] |
3.3 超声场强化
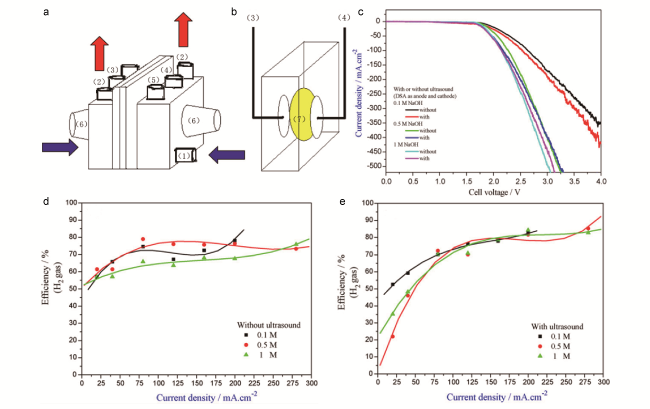
图4 (a)实验装置外观示意图(1进口、2出口水流、3工作电极的位置、4对电极的位置、5参考电极的位置、6超声场的产生);(b)实验装置的横截面(7隔膜);(c)在工作温度为30 ℃、扫描速率为2 mV·s-1时,不同NaOH浓度下施加或不施加超声的电解池电压线性扫描电位曲线;(d)未应用超声场和(e)应用超声场的不同浓度NaOH电解液中H2的生成效率[36]Fig.4 Exterior appearance of the experimental cell. (1) Inlet and (2) outlet water flows, (3) location of the working electrode, (4) location of the counter electrode, (5) location of the reference electrode, (6) generation of the ultrasonic field. (b) A cross section of the experimental cell. (7) Diaphragm. (c) Linear sweep potential curves of the cell voltage for different NaOH concentrations at an operating temperature of 30 ℃ with scan rate of 2 mV·s-1. The efficiency of H2 production (d) without and (e) with application of the ultrasonic field in NaOH solution[36] |
3.4 电场强化
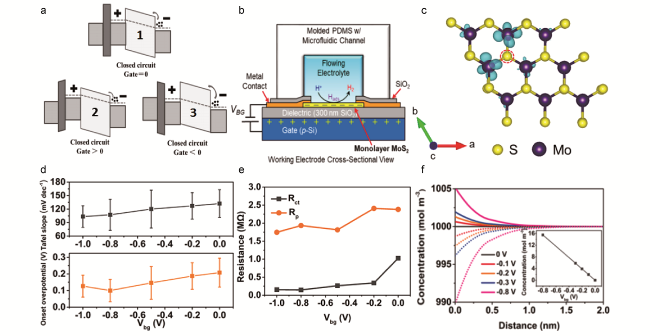
图5 (a)(1)设备在闭合电路无任何栅电压下的正常状态,(2)带正极栅压偏的器件能带,(3)带负极栅压偏的器件能带[66];(b)MoS2工作电极的横截面图(VBG为背栅偏置);(c)单层MoS2的电荷密度差图(图中红色圆圈表示硫空位附近Mo原子的过量电荷)[68];(d)背栅对起始过电位和Tafel斜率的基于统计学的影响(方形点代表平均值,误差条代表标准误差);(e)Rct和Rp的图线;(f)正电荷和负电荷的浓度(实线表示H+,点线表示 )和不同附加电位偏差(0、-0.1、-0.2、-0.3、-0.8 V)下的净电荷(插图)[39]Fig.5 (a) (1) The normal state of device under closed circuit without any gate voltage. (2) The energy band of the device with the positive gate voltage bias, (3) with the negative gate voltage bias[66]. (b) Cross-sectional view of MoS2 working electrode (VBG is back-gate bias). (c) Charge density difference map of monolayer MoS2 (The map shows localization of excess charge on the Mo atoms near the sulfur vacancy denoted by red circles)[68]. (d) Statistic-based influence of the back gate on the onset overpotential and Tafel slope (The square dots are the average values, and the error bar represents standard error). (e) Plot of Rct and Rp. (f) Concentration of positive and negative charges (line represents H+, and dots represent , respectively) and the net charge (inset) under different additional potential biases induced (0, - 0.1, - 0.2, - 0.3, - 0.8 V)[39] |
3.5 超重力场强化
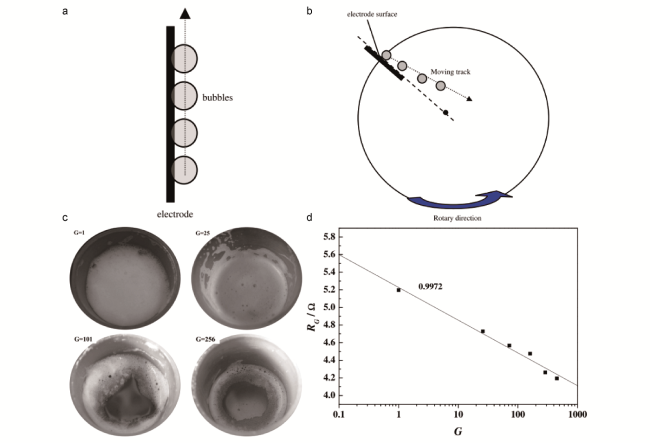
图6 正常重力条件下(a)和超重力场条件下(b)电极表面气泡运动轨迹[40];(c)在不同重力条件下,计时电流法测量电解液中氢泡的状态;(d)在不同的重力系数G值下电解水时的欧姆电阻(RG)[41]Fig.6 Moving track of bubbles on electrode surface under normal gravity condition (a) and high-gravity field (b)[40]. (c) The states of hydrogen foam in electrolyte after chronoamperometry measurement under various gravity conditions. (d) The ohmic resistance (RG) during water electrolysis under various gravity conditions[41] |
3.6 光场强化
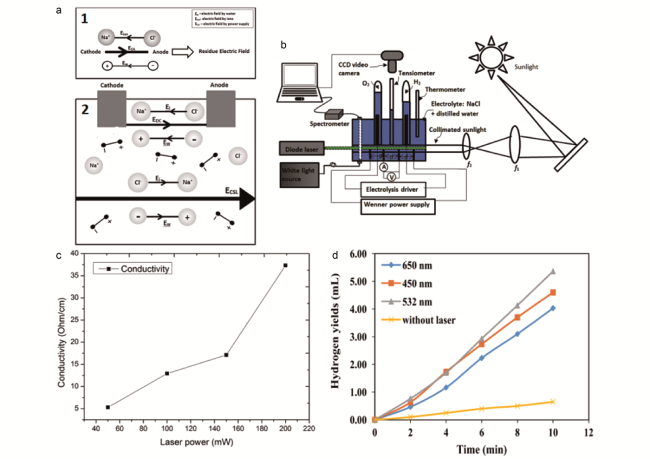
图7 (a)(1)剩余电场效应形成示意图(Eion是在离子化合物之间产生的电场,它与电极产生的电场方向相反;ECA是电极产生的电场);(2)准直阳光的极化和无限特性对增强电解水中电场的重要作用;(b)太阳光对电解水析氢的影响实验装置图;(c)电导率随激光功率的变化[43];(d)在不同的光学光源下,氢产率随时间的变化[73]Fig.7 (a) (1) Residue electric field effect causes the lack of efficiency in water electrolysis (Eion, is electric field induced between ionic compounds which is antiparallel to the field induced by electrode. Meanwhile ECA, is the electric field from the electrodes). (2) The polarization and the infinite behaviour of collimated sunlight attribute to strengthening the electric field in water electrolysis. (b) Experimental setup chart of the effect of sunlight in hydrogen production from water electrolysis. (c) The electrical Conductivity as a function of laser power[43]. (d) Hydrogen yields with respect to time at different optical light sources[73] |
3.7 复合场强化
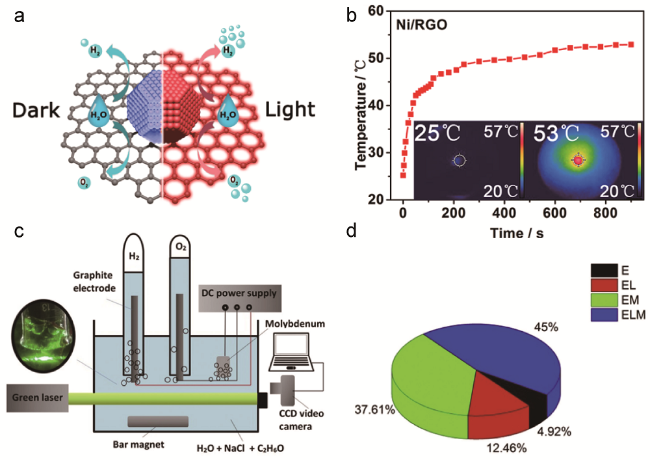
图8 (a)光热效应促进Ni/RGO催化剂HER和OER活性示意图;(b)300 W(强度为 850 mW·cm-2)氙灯辐照1M KOH电解液中Ni/RGO温度随时间变化曲线(插图为辐照前(左)和辐照15 min后(右)Ni/RGO的红外图像)[74];(c)光场和磁场强化电解水析氢实验装置示意图;(d)不同条件下的制氢率:电解(E);光场电解(EL);磁场电解(EM);光场磁场电解(ELM)[73]Fig.8 (a) Schematic illustration of the photothermal-effect-driven strategy for enhancing electrocatalytic HER and OER activities over Ni/RGO. (b) Time-dependent temperature curve of Ni/RGO in 1 M KOH electrolyte under the irradiation of 300 W Xenon lamp (intensity = 850 mW·cm-2) (Inset: Infrared images of Ni/RGO before irradiation (left) and after irradiation (right) for 15 min)[74]. (c)Schematic diagram of experimental device of the effect of magnetic and optic field in water electrolysis. (d) The percentage of Hydrogen yield under different conditions; electrolysis (E) only; electrolysis with laser (EL) electrolysis with magnetic (EM) only; electrolysis with laser-magnet (ELM)[73] |