


1 引言
2 基于团聚构建的比色传感

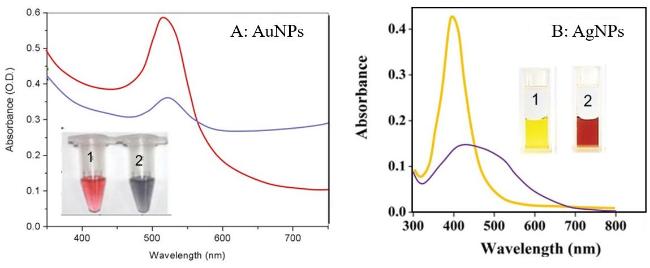
图1 纳米粒子基于电荷排斥稳定和空间位阻稳定(A),纳米粒子基于交联团聚和非交联团聚(B)的示意图,基于DNA-AuNPs比色检测Hg2+(C)[34]以及基于季铵基封端的AuNPs比色检测Hg2+(D)的示意图[37]Fig. 1 Schematic illustration of nanoparticles based on charge repulsion stability and steric hindrance stability(A), nanoparticles based on cross-linked agglomeration and non-cross-linked agglomeration (B), colorimetric detection of Hg2+(C) based on DNA-AuNPs[34] and colorimetric detection of Hg2+ (D) based on quaternary ammonium-terminated AuNPs[37]. Copyright 2007, Wiley,Copyright 2010, American Chemical Society |
2.1 基于金纳米颗粒(AuNPs)和银纳米颗粒(AgNPs)团聚构建的比色传感
2.1.1 基于交联型团聚的比色检测

2.1.2 基于非交联型聚集的比色检测
2.1.2.1 通过表面配体置换引起聚集
2.1.2.2 与粒子表面电荷中和引起聚集
2.1.2.3 适配体修饰AuNPs的非交联型比色分析


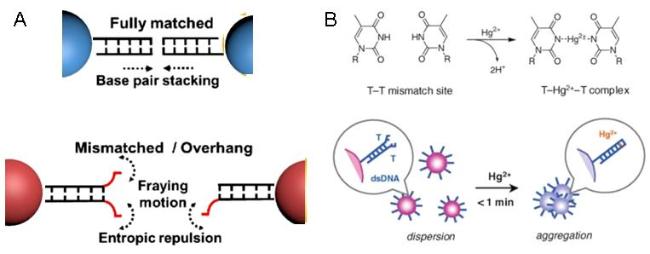
图6 调控dsDNA的末端碱基诱导AuNPs分散和聚集(A);T-Hg2+-T复合物的形成及其诱导dsDNA载金纳米颗粒自发非交联聚集(B)的示意图[72]Fig. 6 Schematic diagram of the terminal base of dsDNA was regulated to induce the dispersion and aggregation of AuNPs (A); the formation of T-Hg2+-T complex and its induced spontaneous non-crosslinked aggregation (B) of dsDNA-loaded gold nanoparticles[72]. Copyright 2011, Royal Society of Chemical |
2.1.2.4 在大尺寸细菌表面聚集
2.1.2.5 基于各向异性纳米粒子的定向聚集比色检测

2.1.3 基于反聚集机理的比色检测

2.2 基于金纳米棒团聚构建的比色传感


图10 AuNRs肩并肩(A,C)和端对端(D,F)聚集示意图和电镜图,随着(MC-LR)浓度的增加AuNRs肩并肩(B)和端对端聚集(E)的光谱变化图[113]Fig. 10 The schematic diagram and electron microscopy of AuNRs shoulder-to-shoulder (A, C) and end-to-end (D, F) aggregation, and the spectral changes of AuNRs side by side (B) and end-to-end aggregation (E) with the increase of (MC-LR) concentration[113]. Copyright 2010, John Wiley and Sons |
3 基于金属纳米颗粒形貌和粒径调控构建的比色传感
3.1 基于对AuNRs刻蚀构建的比色传感
3.1.1 基于氧化反应的刻蚀

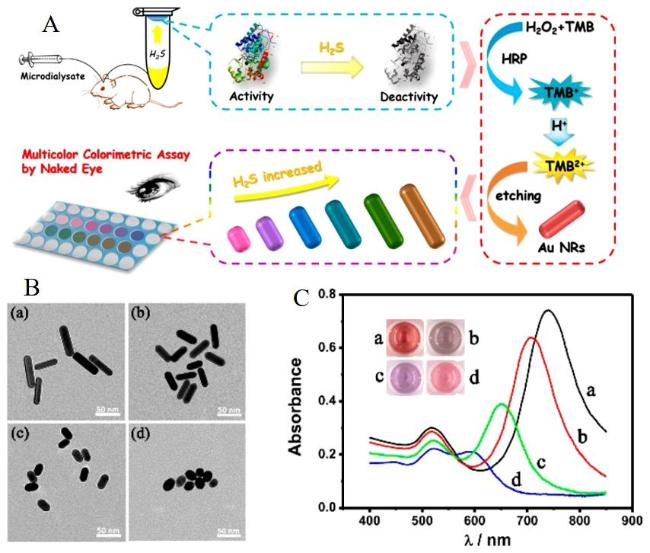
图12 (A)基于H2S抑制HRP的活性从而抑制氧化TMB生成的TMB2+对金纳米棒的刻蚀检测H2S;(B)AuNRs添加不同浓度的H2S((a) 0 µM,(b) 50.0 µM,(c) 5.0 µM and (d) 0.5 µM)电镜图片和紫外吸收光谱图(C)[152]Fig. 12 (A)Detection of H2S based on the inhibition of HRP activity by H2S to inhibit the etching of gold nanorods by TMB2+ generated by oxidation of TMB;(B)AuNRs with different concentrations of H2S((a) 0 µM,(b) 50.0 µM,(c) 5.0 µM and (d) 0.5 µM)electron microscopy and UV absorption spectra(C)[152]. Copyright 2018, American Chemical Society |
3.1.2 基于合金诱导的刻蚀
3.2 基于金纳米双锥刻蚀构建的比色传感

图13 基于O2·-对AuNBPs的刻蚀检测Fe2+的机理图以及AuNBPs在含有1.5 mM KSCN,0.6 mM H2O2和6 mM HCl的水溶液中,不同Fe2+浓度下65 ℃反应10 min得到的紫外-可见光谱(A)及其相应的TEM图像和照片,Fe2+浓度分别为0 µM(B)、0.4 µM(C)、1.0 µM(D)、3.0 µM(E)、5.0 µM(F)、7.0 µM(G)、10.0 µM(H)[169]Fig. 13 The mechanism diagram of Fe2+ detection based on the etching of AuNBPs by O2·- and AuNBPs were dissolved in an aqueous solution containing 1.5 mM KSCN, 0.6 mM H2O2 and 6 mM HCl, the UV-Vis spectra(A)and the corresponding TEM images and photographs obtained at 65 ℃ for 10 min under different Fe2+ concentrations were 0 µM(B)、0.4 µM(C)、1.0 µM(D)、3.0 µM(E)、5.0 µM(F)、7.0 µM(G)、10.0 µM(H), respectively[169]. Copyright 2020, IOP Publishing, Ltd |
3.3 基于三角银的刻蚀构建比色传感

图14 H2O2刻蚀AgNPRs的示意图(A),不同浓度Ni2+催化H2O2刻蚀AgNPRs的溶液颜色变换(B),AgNPRs刻蚀前后的吸收光谱图(C)变换和电镜图片(D)[176]Fig. 14 Schematic diagram of AgNPRs etched by H2O2 (A), the color change of AgNPRs etched by H2O2 catalyzed by different concentrations of Ni2+ (B), the absorption spectra (C)transformation and electron microscopy images (D)of AgNPRs before and after etching[176]. Copyright 2019, Elsevier |
3.4 基于金银双金属纳米材料刻蚀构建比色传感
3.4.1 Au@AgNPs

图15 添加了不同量氰化物后(a)Au@AgNPs,(b)AgNPs和(c)AuNPs的溶液照片;(d)增加不同量氰化物后Au@AgNPs的紫外可见光谱,插图为增加不同量氰化物后Au@AgNPs的TEM图;(e)A394与氰化物浓度的线性图[195]Fig. 15 The solution photos of (a) Au@AgNPs, (b)AgNPs and(c) AuNPs after adding different amounts of cyanide;(d) The UV-visible spectra of Au@AgNPs after adding different amounts of cyanide, and the illustrations are the TEM images of Au@AgNPs after adding different amounts of cyanide;(e) a linear plot of A394 versus cyanide concentration[195]. Copyright 2014, Royal Society of Chemical |
3.4.2 AuNBs@AgNPs
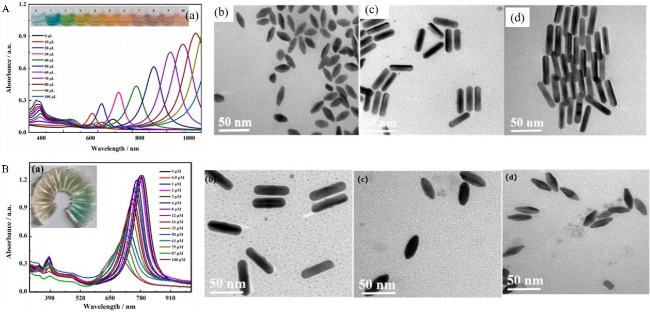
图16 (A) 用0,10,20,30,40,50,60,70,80,90和100 µL的AgNO3(0.01 M)合成的AuNBs@AgNRs样品的紫外-可见吸收光谱。插图:对应的胶体的照片。分别加入不同Ag+浓度制备的AuNBs@AgNRs的TEM图像。(B)AuNBs@AgNRs被Cu2+刻蚀的紫外吸收光谱和溶液照片,以及被刻蚀过程的TEM图片[197]Fig. 16 (A) Ultraviolet-visible absorption spectra of AuNBs@AgNRs samples synthesized with 0, 10, 20, 30, 40, 50, 60, 70, 80, 90 and 100 µL AgNO3 (0.01 M). Illustration: Photo of the corresponding colloid. TEM images of AuNBs@AgNRs prepared by adding different Ag+ concentrations. (B) UV absorption spectra and solution photos of AuNBs@AgNRs etched by Cu2+, as well as TEM images of the etching process[197]. Copyright 2023, Elsevier |
3.4.3 Au@AgNRs

图17 (A)AuNRs表面沉积不同厚度银层的紫外吸收光谱图(a)、胶体溶液颜色图(b)和TEM图(c);(B)不同LSPR峰的AuNRs为核制备的Au@AgNRs对Hg2+的响应吸收光谱图和溶液颜色变换[202]Fig. 17 (A)UV absorption spectra(a), colloidal solution color (b)and TEM images(c)of silver layers with different thicknesses deposited on the surface of AuNRs. (B)The response absorption spectra and solution color transformation of Au@AgNRs prepared with AuNRs with different LSPR peaks to Hg2+[202]. Copyright 2018, Elsevier |

3.4.4 其他异质结构

图18 (A)Au/Ag2S二聚纳米颗粒检测Hg2+的方法示意图;(B)(1) AuNPs;(2) Au@AgNPs;(3) Au/AgINPs;(4) Au/Ag2SNPs;(5) Au/Ag2SNPs + Hg2+的紫外-可见光谱,插图为相应溶液的照片[206]Fig. 18 (A)Schematic diagram of the method for detecting Hg2+ by Au/Ag2S dimer nanoparticles; (B)UV-Vis spectra of (1) AuNPs;(2) Au@AgNPs;(3) Au/AgINPs;(4) Au/Ag2SNPs;(5) Au/Ag2SNPs + Hg2+, illustrated by the corresponding solution[206]. Copyright 2023, Elsevier |
3.5 基于纳米粒子生长构建的比色传感
3.5.1 基于银的沉积生长构建比色传感

图19 基于在金纳米双锥上沉积银构建比色传感的工作机理以及AuNBPs在不同厚度银沉积时的紫外吸收光谱、TEM和照片[218]Fig. 19 The working mechanism of colorimetric sensing based on silver deposition on gold nanobipyramids and the UV absorption spectra, TEM and photos of AuNBPs with different thickness of silver deposition[218]. Copyright 2017, American Chemical Society |


图21 (A)基于HCR的DNA检测与等离子体比色策略示意图;(B)在不同浓度ALP存在下AuNS和AAP混合物的紫外-可见光谱;(C)ALP浓度的峰移与对数的关系图以及检测溶液颜色变化的照片;(D)AuNS和(E)AuNS涂覆的AgNPs的TEM图像[221]Fig. 21 (A)Schematic diagram of DNA detection and plasma colorimetric strategy based on HCR;(B)UV-Vis spectra of the mixture of AuNS and AAP in the presence of different concentrations of ALP;(C)The relationship between the peak shift of ALP concentration and logarithm and the photo of detecting the color change of the solution; TEM images of(D)AuNS and(E)AuNS coated AgNPs[221]. Copyright 2016, Elsevier |
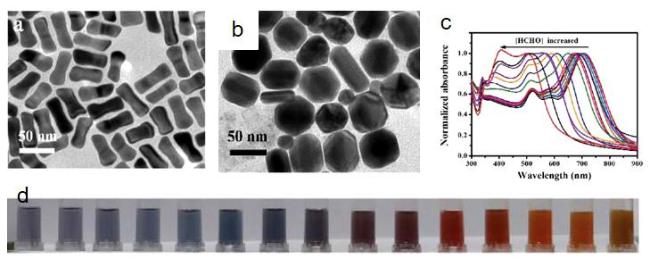
图22 (a)典型的骨骼状AuNRs的TEM图像;(b)AuNRs-Tollens试剂与HCHO反应形成的Au@AgNRs的TEM图像;(c)在优化条件下与不同浓度的HCHO孵育后,骨状AuNRs-Tollens试剂混合物的归一化UV-vis吸收光谱以及相应的照片(d)[224]Fig. 22 (a)TEM images of typical skeletal AuNRs;(b)TEM images of Au@AgNRs formed by the reaction of AuNRs-Tollens reagent with HCHO.(c)After incubation with different concentrations of HCHO under optimized conditions, the normalized UV-vis absorption spectra of the bone-like AuNRs-Tollens reagent mixture and the corresponding photos (d)[224]. Copyright 2019, Royal Society of Chemical |

图23 金-银纳米环制备过程示意图(A)和相应的TEM图(B)以及(C)银沉积在金-银纳米环的示意图、吸收光谱图和电镜图[225]Fig. 23 Schematic diagram of the preparation process of gold-silver nanorings(A)and the corresponding TEM diagram (B)and(C)silver deposition in gold-silver nanorings schematic, absorption spectra and electron microscopy[225]. Copyright 2022, Elsevier |
3.5.2 基于金的沉积生长构建比色传感

图24 低HCl浓度(A)和高HCl浓度(B)下不同量AA还原Au生成Au沉积生成金纳米双锥颜色变化、吸收光谱变换和线性图[226]Fig. 24 The color change, absorption spectrum transformation and linear diagram of gold nanobipyramids formed by different amounts of AA reducing Au to Au deposition at low HCl concentration(A)and high HCl concentration(B)[226]. Copyright 2023, American Chemical Society |
4 比色传感阵列

图25 (A)模拟农药(Gly、Thi、Dic)在水果(梨和葡萄)、蔬菜(甘蓝)和TCBs(金银花、枸杞、桑叶)表面喷洒的过程。(B)用于区分2个水果样品(梨和葡萄)、1个蔬菜样品(甘蓝)和3个TCB样品(金银花、枸杞、桑叶)中3种农药残留的比色传感器阵列;(C)检测实际样品中Gly、Thi和Dic的5个AuNPs的A670/A520[230]Fig. 25 (A)Simulated the spraying process of pesticides ( Gly, Thi, Dic ) on the surface of fruits ( pears and grapes ), vegetables ( cabbage ) and TCBs ( honeysuckle, wolfberry, mulberry leaves ).(B)A colorimetric sensor array was used to distinguish three pesticide residues in two fruit samples ( pear and grape ), one vegetable sample ( cabbage ) and three TCB samples ( honeysuckle, wolfberry and mulberry leaves ).(C)Detection of A670 / A520 of five AuNPs of Gly, Thi and Dic in actual samples[230]. Copyright 2023, Elsevier |