


1 引言
微塑料(Microplastics,MPs)是指粒径小于5 mm的塑料薄膜、碎片、颗粒及纤维等[1]。人类生产生活中产生的废弃塑料经过风化、阳光直射和微生物的分解作用降解为尺寸较小的微塑料。微塑料既具有普通塑料的持久污染性,又因其体积小、易迁移的特性能够在自然环境中广泛分布,目前在水体、大气、土壤以及人体中都有微塑料检出[2]。水生环境中检测出的微塑料主要有聚乙烯(PE)、聚酰胺(PA)、聚丙烯(PP)、聚氯乙烯(PVC)、聚苯乙烯(PS)及聚对苯二甲酸乙二酯(PET)等[2-3]。微塑料自然环境中难以被完全降解,可长期稳定存在于江河湖等地表水中。Rodrigues等[4]分析了英国泰晤士河和葡萄牙Antu河的水样,均检测出了微塑料污染。Tong等[5]取中国不同城市的水样进行研究,发现水中微塑料形态主要为纤维状和碎片状,PP、PE是主要的微塑料成分。微塑料甚至可以进入地下水[6]。表1总结了我国部分淡水水体中微塑料的具体污染情况。
表1 部分淡水环境中微塑料分布情况Table 1 Distribution of microplastics in several freshwater environments |
| Sampling area | Mean abundance/per m3 | Principal components | Particle size /mm | Shape | Ref |
|---|---|---|---|---|---|
| Yangtze River | 4483 | PE(27%) PP(26%) | 0~0.5 | Fibrous (54.63%) Fragmented (32.43%) | 7 |
| Songhua River | (5.72±4.02)×103 | PE, PET, PS | 0~1 | Fibrous (34.69%) Fragmented (26.29%) | 8 |
| East Lake,Hubei | 3329.19 ± 2059.26 | PE, PP | 0.1~1 | Fibrous (84.0%) Fragmented (12.6%) | 9 |
| Wei River | (3.67~10.7)×103 | PE, PVC, PS | 0~0.5 | Fibrous (50.1%) | 10 |
| Taihu Lake | (7.33±1.70)×103 | PET(53.4%) | 0.1~0.5 | Fibrous (92.9%) | 11 |
近年来随着自来水中微塑料的检出[12],其对人体健康构成的潜在风险尤其受到关注。研究认为,以目前饮用水中微塑料的含量而言,短时间内不会对人体造成明显的健康损害,但这不意味着微塑料的生物毒性可以被忽视[13]。微塑料已经在人体胃肠系统和淋巴中检出[14],有研究表明微塑料在肠道中会破坏肠道菌群平衡,导致生物出现营养不良、发育迟缓等症状[15]。纳米级的微塑料可以进入循环系统通过淋巴扩散至全身,甚至可以穿透生物膜屏障,导致生物体组织发生炎症反应,损害免疫细 胞[16]。除本身的生物毒性外,微塑料还因其较大的比表面积容易吸附环境中的重金属和持久性有机污染物(POPs),从而导致复合污染。这意味着微塑料可通过食物链将有毒的有机化合物转移到水生生物,最终富集到人体中。微塑料与有机污染物结合后形成的复合污染物暴露于生物体之后产生的毒性效应较单独污染物的毒性效应更为复杂,这种复杂性源于复合污染物的组成和微塑料与不同污染物的毒性机制间的作用(协同、拮抗或是增强),这种作用可能会放大其对生物的负面影响,引发更严重的分子、细胞和组织方面的变化[17]。Rochman等[18]研究发现淡水环境中微塑料对POPs的吸附产生了复合毒性,扰乱了鱼类的内分泌系统并损害了生殖系统,可能会对鱼类的繁衍产生深远的影响。此外,微塑料在吸附POPs后会发生解吸,研究发现微塑料进入到生物肠道内后,部分POPs的解吸量比在海水中高出30倍[19]。研究微塑料吸附和解吸其他污染物的过程,了解二者相互作用的机制,对评价微塑料的环境风险是十分必要的。
抗生素(Antibiotics)近年来在水环境中频繁检出[20]。基于化学结构,抗生素可大致分为大环内酯类、四环素类、磺胺类和喹诺酮类等。除用于人类的医疗用途之外,抗生素还作为生产抑制剂广泛应用于水产养殖、畜牧业及渔业等产业,这导致了大量抗生素以原生态和代谢物状态的形式排入自然水体中造成污染[21]。抗生素进入水环境之后会经由多种途径发生迁移转化,吸附则是抗生素在环境中发生迁移的关键过程[22]。抗生素与环境介质之间的吸附与其自身的结构和官能团性质密不可分,研究表明喹诺酮类抗生素和四环素类抗生素因具有较多的极性官能团(羧基、羟基),易被环境中的颗粒物质所吸附;而磺胺类抗生素一般仅有两个离子型官能团(酰胺基和苯胺基),因此其被吸附的能力较弱[23]。
准确评价微塑料-抗生素复合污染物毒性和环境危害、明晰微塑料和抗生素的相互作用是研发复合污染物去除技术的前提。因此本文分析了二者形成复合污染的危害,系统地总结了微塑料与抗生素之间的相互作用机理及影响这种相互作用的因素。二者的复合污染在水处理去除过程中,较单独污染存在不同的特点,本文就两种水处理典型技术(混凝、高级氧化法)对微塑料-抗生素复合污染的去除特性进行了介绍。
2 微塑料-抗生素复合污染物的危害
水体中的微塑料可能作为抗生素的载体,且有机污染物与微塑料的结合会增强其毒性[26]。微塑料与抗生素产生的复合污染主要是微塑料吸附抗生素之后在环境中发生迁移,进而改变了二者的空间分布[27]。这种迁移包括水生动物摄食微塑料之后同时摄入抗生素,进而产生了污染物的蓄积并增强了毒性,如Fonte等[28]发现水中PE微塑料的存在增强了头孢氨苄对虾虎鱼的毒性,且二者的复合污染影响了虾虎鱼的捕食性能和乙酰胆碱酶水平,与单独污染表现出了差异。微塑料上的抗生素直接影响也吸附在微塑料上细菌群落的抗生素耐药基因(ARG)的表达,进而选择出抗生素耐药细菌(ARB)的群落[29]。研究表明,聚集在微塑料表面的生物膜中的ARBs比周围水环境中的ARBs浓度高100~5000倍[30]。
 唑(SMX)3种抗生素及PS微塑料研究微塑料和抗生素污染对贻贝的影响,结果表明相比于单独污染,复合污染对贻贝体现出了协同免疫毒性,并导致了贻贝血细胞活力的下降和免疫相关基因的下调。
3 微塑料与抗生素的相互作用机理
 唑、普萘洛尔和舍曲林)的吸附效果。实验中溶液的pH约为6.85,而3种抗生素的pKa分别是1.90、9.42和9.85,因此磺胺甲
  唑带负电,普萘洛尔和舍曲林带正电。而PE的pHPZC为4.3,则PE也带负电。实验结果表明PE的确对两种带正电的抗生素具有更高的吸附量,证明了静电作用对抗生素吸附作用的影响。
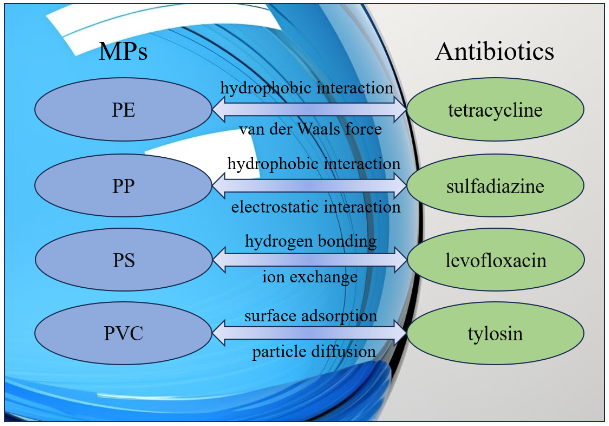
π-π相互作用、氢键和范德华力通常也参与抗生素和微塑料的吸附,虽然这部分作用比共价键要弱[43]。研究发现,抗生素与多种微塑料均存在范德华力作用[44]。而π-π相互作用作为一种来自范德华力的特殊色散力,一般发生于含有芳香结构或双键的微塑料和抗生素之间,如PS类微塑料即可在吸附过程中作为电子供体,与含有苯环或双键的污染物(如四环素)之间发生π-π相互作用[45]。氢键的形成可以提高微塑料对亲水性污染物的吸附效果。氢键和极性作用一般存在于含较多羟基、羰基等基团的老化微塑料与亲水性有机污染物的吸附过程中[46]。实际上,真实的吸附过程往往是由几种机理共同作用促成的,如研究发现纳米级PS对喹诺酮类抗生素(左氧氟沙星、诺氟沙星等)的吸附机理就包括氢键、极性作用和静电相互作用等[47]。部分微塑料与抗生素之间的吸附机理如图1所示。
4 微塑料与抗生素相互作用的影响因素
除微塑料自身的形貌之外,其粒径大小、是否团聚也会影响其对抗生素的吸附能力。一般而言,微/纳米塑料的粒径越小,比表面积就越大,可提供的吸附点位也更多,吸附能力就越强[49]。纳米PS对抗生素的吸附能力要远高于微米PS,主要原因就是比表面积的差距。但是随着研究的进一步深入,人们发现吸附能力也并不总是随着微塑料粒径的减小而提升。Yu等[50]用不同粒径的PE进行对四环素的吸附实验,结果表明随着PE粒径的减小,其对四环素的平衡吸附量逐渐提升,但当粒径达到几十纳米级别时,吸附量反而下降。这可能是由于当微/纳米PE粒径过小时,其在水中的存在并不稳定,而倾向于发生团聚反应,形成较大的团聚颗粒,导致比表面积下降,从而影响吸附效果。
微塑料和抗生素所处环境条件对二者的吸附作用的影响也不可小视,如pH、温度、盐度及共存有机大分子影响等。近年来相关研究越来越重视pH对微塑料对抗生素吸附作用的影响。Zhang等[47]研究了pH对纳米PS吸附喹诺酮类抗生素的影响,发现吸附量随pH的增加均呈现先增加后减少的趋势,这与pH对PS表面电性以及抗生素存在形态影响有关。Puckowski等[54]研究了pH对诺氟沙星在不同种微塑料上吸附的影响,结果表明pH值为4时诺氟沙星在PE上的吸附量达到最大,而pH值为12时在PP、PVC上的吸附量最大。这种由pH变化而产生的结果差异也表明了pH是通过静电相互作用对微塑料和抗生素的吸附产生影响[55]。
温度也是影响吸附效果的主要因素之一。对于大多数抗生素而言,随着水温的降低,抗生素的溶解度降低、疏水性升高,更容易被微塑料所吸附;当温度升高时,抗生素溶解度升高,分子热运动增强,使吸附变得不稳定。但Chen等[56]研究发现PE对泰乐菌素(TYL)的吸附量随温度升高而增大,这是由于TYL在PE上的吸附破坏了微塑料周围的水合壳,进而增大了系统的混乱度(熵增过程),则升高温度可提升PE对TYL的吸附效果。这也说明了温度的影响不是绝对的,而是和微塑料/抗生素本身性质有关。盐度对不同有机污染物的吸附存在促进或抑制作用,对于抗生素则主要体现为竞争吸附点位的抑制作用。当盐度升高时,由于大部分微塑料带负电,正电荷离子(钠离子、镁离子和钙离子等)带正电,其可通过静电引力附着到微塑料表面,占据吸附点位,从而抑制微塑料对抗生素的吸附。正电荷离子还可能通过静电吸附作用替换微塑料的含氧基团,阻碍氢键的形成,降低吸附效果[57]。有机大分子的影响与盐度类似,一般情况下,溶解性有机大分子与微塑料的亲和度要高于抗生素,但也有部分有机物对抗生素的吸附起促进作用。Zhang等[58]在研究腐殖酸对PS微塑料吸附土霉素的影响时发现腐殖酸明显促进了吸附过程,原因可能是腐殖酸在二者的吸附作用中通过π-π共轭、氢键等作用力发挥了桥梁的作用。
5 混凝去除微塑料与抗生素复合污染
混凝法是一种应用广泛的常规水处理工艺,有着技术成熟、操作简单及成本低廉等优点,其在微塑料的去除方面也表现出优越的性能。一般而言,对于微塑料-抗生素复合污染物,混凝的去除机理主要是电荷中和作用。混凝剂会中和污染物的表面电荷,降低静电斥力,从而聚合在一起形成大体积絮状物,经由沉淀去除[63]。在实验室条件下模拟混凝去除微塑料的工艺中,最优去除率可超过90%,但在实际水厂净水处理过程中很难达到。水厂中传统的铝盐和铁盐混凝剂对低密度微塑料(如PE等)的去除效率在29.70%~70.70%,而对高密度微塑料(如PS、PET等)的去除率则达到了77.83%~99.40%,原因可能是高密度微塑料的沉降性能更明显[64]。与单独的微塑料污染处理相比,微塑料与抗生素的复合污染的情况更为复杂,不同组分间的相互作用会改变污染物的行为,进而对混凝过程产生不可预测的影响。Lu等[65]研究了四环素和PET复合污染物的混凝去除,发现与单独的PET和四环素混凝相比,PET的去除率降低了9%,而四环素的去除率上升了13%。为进一步了解微塑料-抗生素复合污染物的混凝机理,He等[66]用聚合氯化铝(PAC)为混凝剂,聚丙烯酰胺(PAM)为助凝剂进行了PE-诺氟沙星(NOR)的混凝实验,结果表明与单独的PE 或 NOR处理相比,NOR的存在显著提高了PE的去除率,提高了约19.5%;而PE的存在略微降低了NOR的去除率,约为4.1%。对机理的分析表明,混凝去除PE-NOR复合污染物的主要机理是电中和作用、吸附架桥作用和卷扫作用,在这一过程中,PE-NOR-Al络合物的吸附架桥作用是提高PE去除率的原因,而PE则通过电中和效应的竞争作用降低了NOR的去除率。图2显示了混凝系统中具体的PE/NOR去除机理。
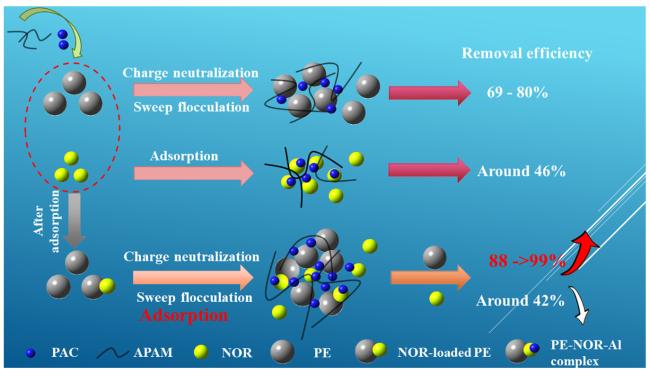
结果表明在中性和弱碱性环境下,去除效果比弱酸性环境下要好,且水中的Ca2+和Mg2+等金属离子会显著降低复合污染物的去除率,这印证了上文提到的pH和盐度对微塑料和抗生素吸附的影响。而当水中存在HA时,PE和NOR的去除率均迅速增加,当HA浓度由0增加到10 mg/L时,PE的去除率由56.3%提高至95.8%,NOR的去除率则由20.4%提高到51.1%,这是由于HA与铝基混凝剂的相互作用所致[67]。
6 高级氧化法降解微塑料-抗生素复合污染
高级氧化技术(AOPs)是广泛应用于环境中难降解污染物的分解去除的一种水处理技术,包括芬顿氧化法、过硫酸盐法和臭氧催化法等。高级氧化法的核心原理是产生具有强氧化性的活性自由基将难降解有机污染物氧化分解为低毒或无毒的小分子物质,部分情况下甚至可以直接降解为二氧化碳和水[68]。与传统的水处理工艺相比,高级氧化法具有反应活性强、应用范围较广、处理效果更为彻底等优点,其在降解处理新兴污染物方面具备一定的优势。
芬顿工艺的原理是通过Fe2+催化H2O2产生羟基自由基(HO·),工艺优点是反应速度快,工艺简单且能耗较低。Furia等[69]使用活化芬顿工艺处理含有高浓度抗生素的医疗废水,效果显著。HO·作为一种无选择性自由基,除了微塑料之外也会无差别攻击其他污染物,同时微塑料可作为载体吸附水中的Fe2+和Fe3+,这些因素均可能影响芬顿工艺对复合污染物的去除效果。处理后,剩余的微塑料表面会进一步发生变化,其理化性质也会改变[70]。Yao等[71]研究微塑料对芬顿工艺处理抗生素的影响,选用聚丙烯(PP)和磺胺类抗生素为实验对象,通过扫描电子显微镜(SEM)表征微塑料在经由芬顿工艺处理前后的变化,发现在反应之后,微塑料表面附着了絮状物和碎屑,且孔隙间填充了颗粒状物质;能量色散X光谱(EDS)分析结果表明,芬顿工艺处理后微塑料表面铁元素和硫元素的相对含量分别从0.35%增加到1.81%、从1.48%增至4.29%。该结果说明微塑料的确会在芬顿反应过程中吸附Fen+、磺胺类抗生素及其衍生物Fen+等,且作为载体的吸附效应得到了加强。PP对HO·的消耗也影响了磺胺类抗生素的去除率和矿化率,且PP自身的破碎度、亲水性和吸附能力均升高。
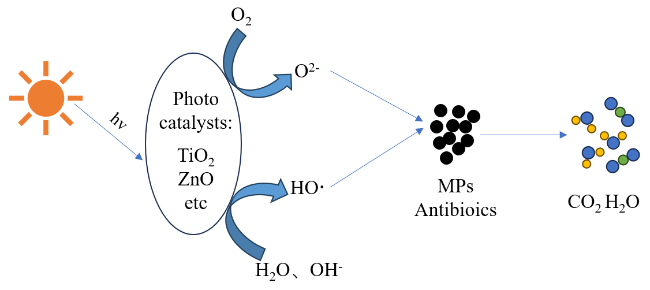
二氧化钛(TiO2)是常用的紫外光催化剂,Nabi等[73]使用紫外光照射TiO2纳米颗粒薄膜催化PE和PS的氧化降解,结果表明经过3~6 h的照射后,PS的形态和大小发生显著变化,且在12 h内98.4%的400 nm PS完全矿化,经由红外光谱分析表明微塑料经由光催化降解最终转化为CO2。Fu等[74]研究发现,K2S2O8与波长< 270 nm的紫外光联用能将浓度为15 mg/L的四环素完全去除,将其降解为小分子酸、CO2等。Ye[75]使用UV/H2O2组合光催化工艺去除原水中的抗生素,与水厂的常规和深度处理工艺相比,四环素类抗生素和磺胺类抗生素的去除率分别提高了75.5%和68.4%,且随着UV照射剂量增加,大部分抗生素的去除率也明显提升,结合实际情况,得出推荐照射剂量为1400~1500 mJ/cm2。而H2O2投加量的增加则对降解效果影响不大,且投加量增大后其利用率会降低,实验测得最佳投加量为3 mg/L。
由紫外光驱动的催化剂存在光能利用率较低、波长吸收范围较窄等弊端,进而拓展了可见光催化剂的研发,目前常用的可见光催化剂有氧化锌(ZnO)、生物炭、有机半导体等,它们具有优异的光学性能。Jiang等[76]以可溶性BiOCl-OH半导体有机骨架为可见光催化剂,氙灯为光源研究了PS微塑料和四环素复合污染的光催化降解,结果表明适当浓度和大小的PS会促进四环素的降解,且改变降解途径;四环素的存在促进了体系中PS的老化,使其表面发生碎裂,说明二者在光催化降解中体现为协同作用。对机理的研究表明PS加快了系统中的电荷转移和自由基的产生,而四环素改变了电荷的界面分布并增强了光吸收。
光催化法降解微塑料-抗生素复合污染受微塑料的形状与粒径等因素的影响。Jiang等[76]研究了不同尺寸(100 nm~10 μm)的PS对四环素的光催化降解影响,发现PS尺寸越小,对四环素的吸附效果越好,降解效率也越高。外部因素如pH和温度等也应当会影响光催化降解复合污染物的效果,但目前该方面的研究稍显不足。
除羟基自由基之外,基于硫酸根自由基(SO4•−)的AOPs反应体系近年来备受关注。SO4•−的常见生成工艺是通过光催化、过渡金属催化等方式激活过硫酸盐(PS)和过氧单硫酸盐(PMS)产生。与芬顿工艺相比,过硫化物氧化法具有更宽的pH适用范围[77]。Zhu等[78]通过纳米FeCo2O4/Co3O4复合材料活化过硫酸盐进行四环素的处理,在120 min内四环素的去除率达到了91.63%。 Wei等[79]研究了PP和PE微塑料对CoFe2O4/PMS高级氧化体系降解盐酸四环素(TCH)的影响,发现PP和PE投加量为100 mg/L时对TCH的降解成促进作用,分别提高了4.3%和3.5%,且未老化微塑料的促进作用优于老化后的微塑料。采用傅里叶红外光谱仪(FTIR)分析了反应前后PP、PE微塑料的表面官能团变化,发现其表面新增了对称/反对称羧基基团和羟基基团,说明微塑料在反应过程中会消耗CoFe2O4/PMS体系中的自由基,与TCH为竞争关系;但同时微塑料可作为CoFe2O4的载体,使催化材料分布更均匀,促进TCH的降解,这说明微塑料与抗生素在高级氧化处理过程中出现的相互作用可能是十分复杂的[80]。使用液相色谱-质谱联用技术(LC-MS)分析PP、PE-TCH联合降解产物,结合化学计算分析推断出了复合污染物的降解途径:羟基取代、双键断裂开环是主要途径,随后是脱酸化和自由基加成。检测结果还说明微塑料改变了TCH的分子结构、亲电反应点位和易受自由基攻击的点位,进而影响了TCH的降解路径。
7 结论与展望
近年来,水体中微塑料与抗生素对环境和人体的危害已受到人们的广泛关注,由于微塑料的结构特征,微塑料可作为环境中抗生素的载体将其吸附,二者间的吸附原理主要有疏水作用、氢键、π-π作用、范德华力和静电作用等,吸附后形成的微塑料-抗生素复合污染物的毒性可能更强。影响微塑料和抗生素吸附的因素则包括微塑料自身的形貌和尺寸、环境pH、温度、盐度及有机大分子等。
水中微塑料和抗生素的去除也正成为水处理中热点问题。混凝沉淀法作为一种传统的水处理工艺,在去除微塑料/抗生素时也体现出了卓越的性能。高级氧化法也因处理效果好,氧化方式多样而受到学者的关注,常用的高级氧化法包括芬顿氧化、光催化氧化和过硫酸盐氧化等。分析不同工艺对复合污染的处理效果及影响工艺过程的各种因素是目前的研究热点之一。需要注意的是现有的水处理工艺并不是专门为处理水中的微塑料、抗生素设计的,而大部分关于微塑料/抗生素去除的工艺研究还处于实验室阶段,距离大规模应用尚有一段距离。改善现有的水处理工艺流程,推进微塑料-抗生素复合污染物的去除研究,应是未来水处理方向的重要议题。