


1 引言
表1 商业化锂离子电池正极材料对比[13⇓⇓~16]Table 1 Comparison of commercial cathode materials of lithium-ion batteries [13⇓⇓~16] |
| Cathode materials | LiMn2O4 | LiFePO4 | LiCoO2 | LiNixCoyMnzO2 |
|---|---|---|---|---|
| Crystal structure | Spinel structure (Fd-3m) | Olivine structure (Pmnb) | Layered structure (R-3m) | Layered structure (R-3m) |
| Theoretical capacity | 148 mAh/g | <165 mAh/g | 274 mAh/g | ≈280 mAh/g |
| Practical capacity | 100~120 mAh/g | 170 mAh/g | 140~155 mAh/g | 155~200 mAh/g |
| Voltage platform | 4.1 V | 3.4 V | 3.8 V | 3.7 V |
| Tap density | 2.2~2.4 g/cm3 | 1.0~1.7 g/cm3 | 2.8~3.0 g/cm3 | 2.0~3.0 g/cm3 |
| Energy density | ~440 Wh/kg | ~570 Wh/kg | ~570 Wh/kg | ~800 Wh/kg |
| Cycling performance | >500 cycles | >2000 cycles | >500 cycles | >800 cycles |
| Cost | Low | Low | High | Medium |
| Safety | Medium | High | Low | Medium |
| Application | EVs | Energy storge and EVs | 3C | 3C、EVs |
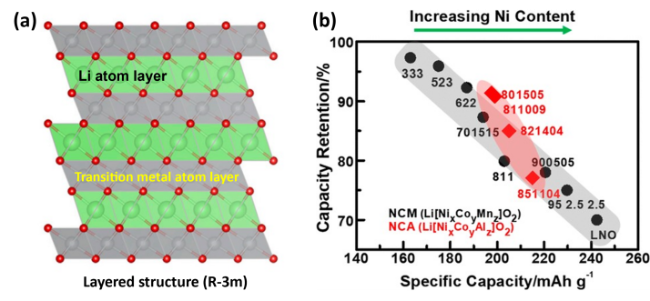
图1 (a)锂层、过渡金属层交替排列的层状结构分子模 型[3];(b)不同Ni含量的NCM/NCA材料比容量与循环100圈容量保持率关系对比图[4]Fig. 1 (a)Molecular pattern of layered structure with alternate array of Li layer and transition metal layer[3], (b)Relationship between specific capacity and its retention of NCM/NCA with an increasing Ni contents[4]. Copyright 2017, American Chemical Society |
2 合成方法
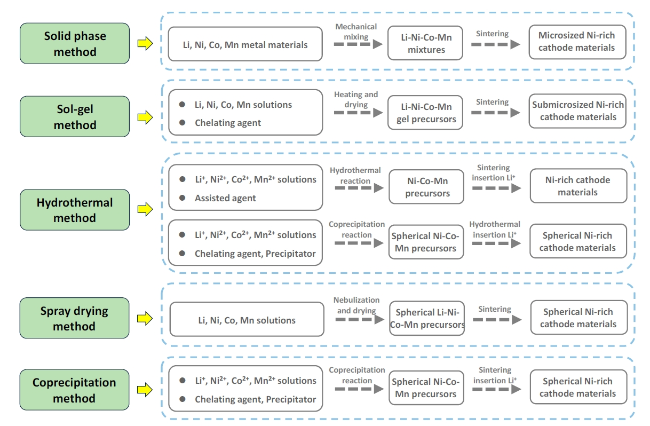
2.1 固相法
2.2 溶胶凝胶法
2.3 水热法
2.4 喷雾干燥法
2.5 共沉淀法
| Advantages | Disadvantages | Applicable level | |
|---|---|---|---|
| Solid state method | Simple and easy to be scaled up | Uneven elemental distribution, uncontrolled morphology, low tap density and unstable electrochemical performance | Less application directly using raw material synthesis and widely used combined with other methods |
| Sol-gel method | Homogeneous element distribution and fine particles with high electrochemical reactivity | Additional organic acids, substantial energy consumption and low product tap density | Laboratory scale |
| Hydrothermal method | Desired morphology and grain assembling, high electrochemical reactivity | High demand for hydrothermal conditions and low treatment efficiency | Laboratory scale |
| Spray drying method | Environmentally friendly and simply | Low product tap density | Laboratory scale |
| Coprecipitation method | Dense and narrowly distributed precursors, strong controllability, high tap density and excellent electrochemical performances | High reagent consumption, alkali wastewater, ammonia pollution and numerous control parameters | Almost becoming the only choice in industry |
3 失效机制
3.1 离子混排与不可逆相变
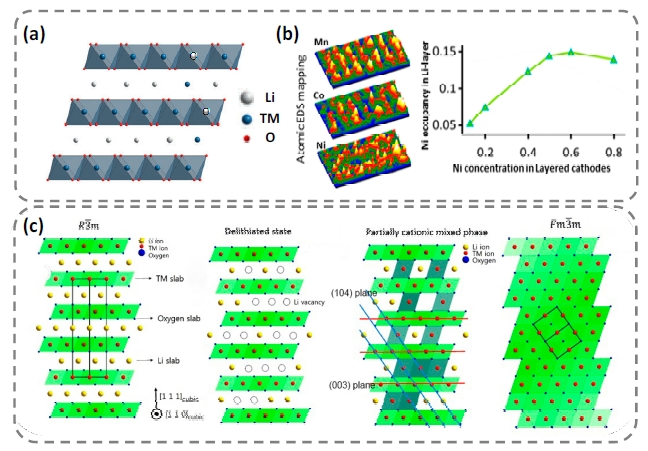
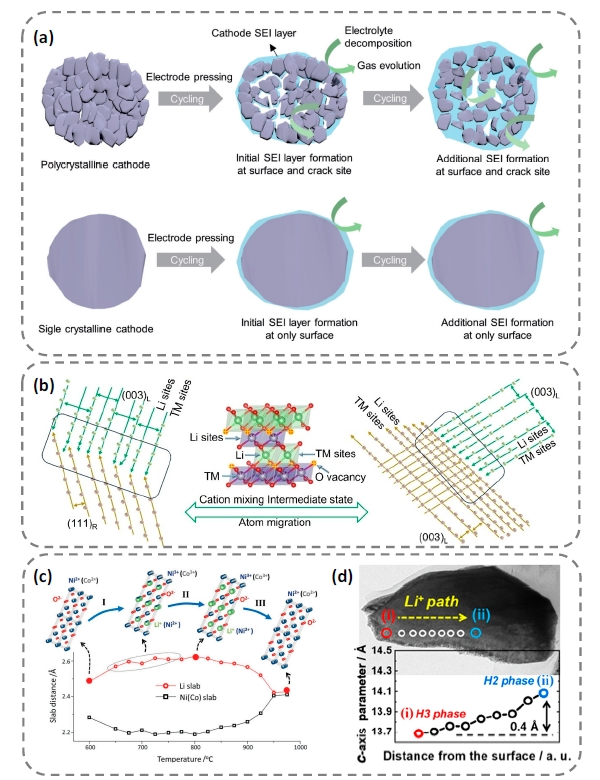
图3 高镍材料(a)离子混排示意图[9]、(b)离子混排过程中Ni、Co、Mn在层状原子列中的分布[32]、(c)初始态、脱Li+态、脱Li+态混排及岩盐相结构示意图[43]Fig. 3 Ni-rich cathode materials(a)Schematic diagram of ion disorder[50], Copyright 2021, American Chemical Society(b)Ni, Co and Mn distributions during ion disorder[32], Copyright 2015, American Chemical Society and(c)original structure, delithiated state, delithiated state with Li/Ni mixing, and rock-salt phase[43]. Copyright 2015, John Wiley and Sons |
3.2 表面残碱和界面副反应

图4 高镍材料(a)残碱形成示意图、(b)表面CEI膜的形成及其组成成分[43,55]、(c)残碱导致的浆料凝胶化及其(d)形成过程[53]、(e)水洗去除表面残碱过程[59]Fig. 4 Ni-rich cathode materials (a)Schematic diagram of the formation of residual Li species, (b)formation of CEI film and its components[43,55], Copyright 2015, John Wiley and Sons (c)cathode slurry gelation caused by residual Li species and (d)corresponding formation process[53], Copyright 2021, American Chemical Society(e)Schematic diagram of removal of residual Li species by virtue of washing[59]. Copyright 2020, Frontier |
3.3 应力诱导微裂纹
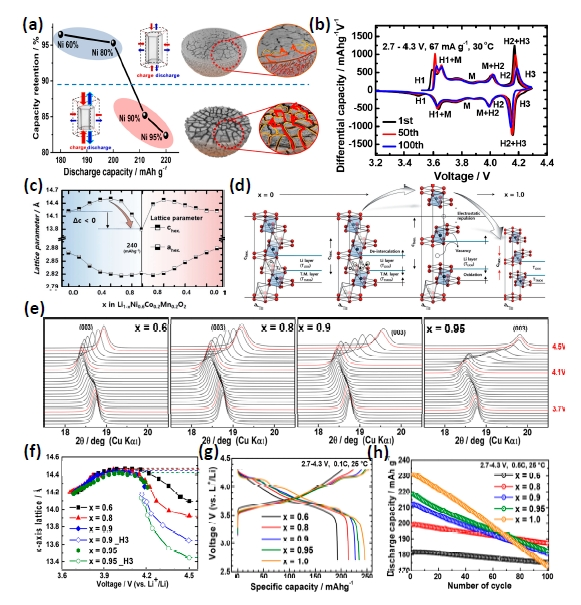
图5 高镍材料(a)微裂纹示意图[10]、(b)充放电微分容量曲线[65]、(c)充放电过程晶格参数a、c变化、(d)充电过程晶胞沿c轴的异向伸缩[62];不同Ni含量高镍LiNixCoyMn1-x-yO2材料(e)充电过程(003)衍射峰偏移、(f)充电晶格参数c变化、(g)充放电曲线、(h)循环性能[10]Fig. 5 Ni-rich cathode materials,(a)Schematic diagram of microcracks[10], Copyright 2018, American Chemical Society (b)differential capacity curves[65], Copyright 2019, American Chemical Society (c)Change of lattice parameters a and c during charge and discharge, (d)Change of interlayer spacing of crystal along c axis during charge[62], Copyright 2017, John Wiley and Sons; Different Ni contents of Ni-rich LiNixCoyMn1-x-yO2 materials for (e)(003) diffraction peak variation of XRD during charge (f)change of lattice parameter c during charge, (g)charge-discharge curves, (h)cycling performances[10]. Copyright 2018, American Chemical Society |

图6 高镍材料(a)晶间与晶内微裂纹示意图[71];(b)充电过程晶格参数a、c、晶格失配变化及(c)晶体结构变化示意图[27];原位STEM-HAADF下LiNi0.6Co0.2Mn0.2O2材料4.7 V脱Li+态(d)常温单晶形貌及其(e)裂纹区域微观结构、(f)275 ℃受热状态下的单晶形貌及其(g)裂纹区域微观结构、(h)裂纹附近微观结构、(i)裂纹微观结构[68]Fig. 6 Ni-rich cathode materials (a)schematic diagram of intergranular and intragranular microcracks[71], Copyright 2020, American Chemical Society (b)change of lattice parameter a, c and lattice mismatch during charging, (c)Schematic diagram of the change of crystal structure during charging[27], Copyright 2022, John Wiley and Sons; In-situ STEM-HAADF of delithiated LiNi0.6Co0.2Mn0.2O2 at 4.7 V (d)morphology of single grain at room temperature and its (e)microstructure located at microcracks, (f)morphology of single grain at 275 ℃ and its microstructure located at (g)microcracks, (h)near microcracks and (i)microcracks[68]. Copyright 2018, Springer Nature |
3.4 过渡金属溶解
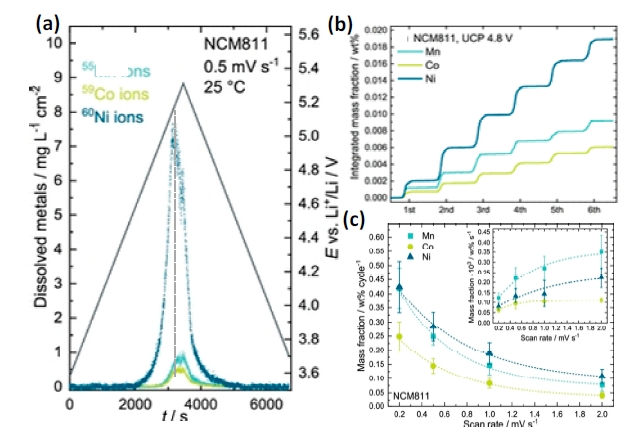
图7 (a)电池在0.5 mV/s、3.5~5.3 V下伏安循环并利用ICP-MS实时测试的LiNi0.8Co0.1Mn0.1O2材料在有机电解液中的TM溶解浓度、(b)LiNi0.8Co0.1Mn0.1O2材料在初始6圈内的TM累计溶解质量分数、(c)首次循环不同扫速下(0.2、0.5、1、2 mV/s)LiNi0.8Co0.1Mn0.1O2材料TM的溶解质量分数(插图为首次循环不同扫速下单位时间内TM的溶解质量分数)[73]Fig. 7 (a)Continuous time-resolved dissolution profile of the transition metals Mn, Co, and Ni measured using the EFC−ICP-MS in the course of a potentiodynamic measurement in the range of 3.5~5.3 V vs Li+/Li at 0.5 mV·s−1 to LiNi0.8Co0.1Mn0.1O2 with 1.0 mol·L−1 LiPF6 in EC/EMC, 3:7 wt%; (b)Integrated curves of the dissolution profiles shown with respect to the cathode material’s initial metal content and thus expressed as mass fraction; (c)Dissolved mass fraction of Mn, Co, and Ni from LiNi0.8Co0.1Mn0.1O2 measured during the first cycle of a CV conducted to 5.3 V vs Li+/Li at four scan rates: 0.2, 0.5, 1, and 2 mV·s−1. Mass fractions are shown per cycle and per time (inset), revealing an exponential progression[73]. Copyright 2021, American Chemical Society |
4 改性方法
4.1 离子掺杂
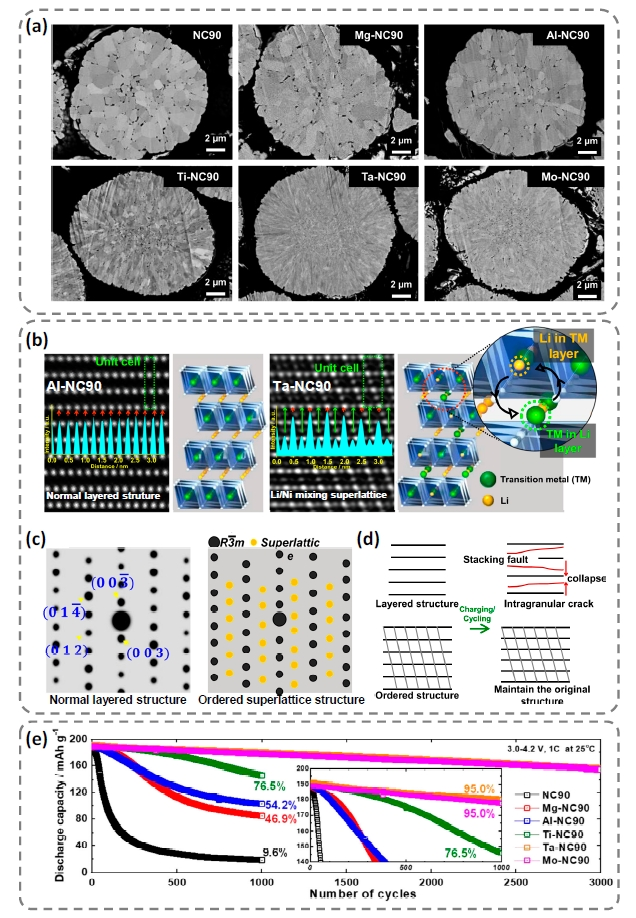
图8 (a)NC90原样及Mg2+、Al3+、Ti4+、Ta5+和Mo6+分别掺杂的材料剖面图;(b)Al3+掺杂样品(层状结构)和Ta5+掺杂样品(有序Li/Ni混排超晶格)的HAADF-TEM图及分子模型;(c)层状结构和有序Li/Ni混排超晶格结构的电子衍射图及(d)循环过程中结构转变示意图、(e)原样及不同价态离子掺杂材料的长循环稳定性[93]Fig. 8 (a) Cross-sectional SEM images of pristine and Mg2+, Al3+, Ti4+, Ta5+, and Mo6+ doped NC90 materials, (b)HAADF-TEM images of Al-NC90 (layered structure) and Ta-NC90 (Li/Ni mixing superlattice structure) and models, (c)electron diffraction patterns of layered structure and Li/Ni mixing superlattice structure, and (d)schematic diagram of structure evolution during cycling, (e)long-term stability of pristine and doped NC90 samples in pouch-type full cells[93]. Copyright 2021, Springer Nature |
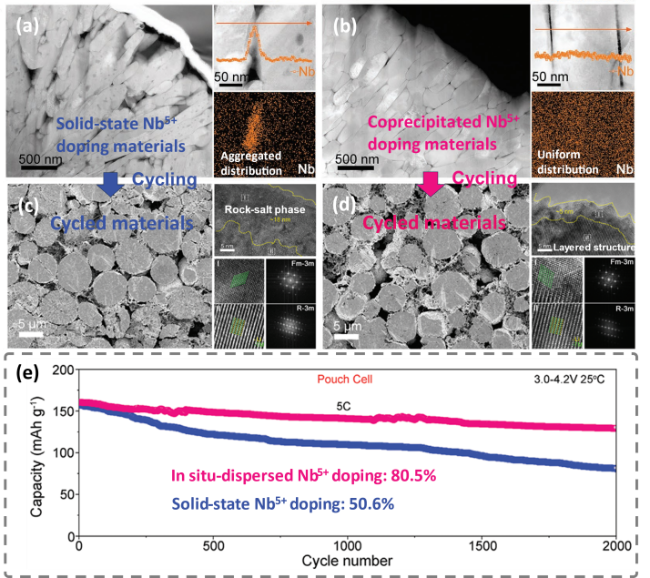
图9 高镍材料(a)固相Nb5+掺杂样品、(b)共沉淀原位Nb5+掺杂样品剖面形貌和晶间Nb5+分布;循环后(c)固相Nb5+掺杂材料、(d)共沉淀原位Nb5+掺杂材料剖面形貌和表面晶格结构、(e)全电池循环性能[94]Fig. 9 Cross-sectional morphology and Nb5+ distribution of Ni-rich cathode materials for (a)solid-state Nb-doping, (b)coprecipitated in-situ Nb-doping; Morphologies and lattice structure after cycling of (c)solid-state Nb-doping, (d)coprecipitated in-situ Nb-doping, and their (e)cycling performance in pouch cell[94]. Copyright 2023, John Wiley and Sons |

图10 高镍材料(a)DFT模拟计算卤阴离子掺杂Li/Ni反位形成能、(b)F-固相掺杂示意图;不同掺F-量材料的中子衍射精修图谱(c)原样、(d)掺F-1%、(e)掺F-2%;(f)原样和掺F-1%循环性能;(g)原样、掺F-1%、掺F-2%能带带隙[95]Fig. 10 Ni-rich cathode materials (a) Effect of F, Cl, Br, and I substitution on the calculated Li/Ni antisite formation energies, (b)schematic diagram of F- substitution during precursors lithiation sintering; Neutron diffraction refinement patterns of (c)pristine, (d)1% F-doping, (e)2% F-doping, (f)cycling performances of pristine and 1% F-doping; (g)Band gaps of pristine, 1% F-doping, and 2% F-doping[95]. Copyright 2018, John Wiley and Sons |

图11 (a)B、Al原子结构和相应的轨道杂化;DFT模拟(b)B、Al分别掺杂表面、第一、第二、第三原子层结构能量、(c)B、Al分别从第一原子层迁移到第二原子层的迁移能、(d)有Al和无Al时B从表面迁移到第一原子层的能量;(e)B、Al协同竞争掺杂示意图[58]Fig. 11 (a)Atomic structures and orbit hybridization of B and Al; Theoretical calculations of Al/B co-doping: (b)Corresponding energy of different structures with doping Al and B to the surface, 1st, 2nd, and 3rd layer, respectively, (c)Al and B migration energy barrier from the first layer to the second layer, (d)B migration energy barrier from the surface to the first layer with Al and without Al. (e)Schematic diagram of competitive Al/B co-doping in one-pot synthesis[58]. Copyright 2023, John Wiley and Sons |
4.2 表面包覆
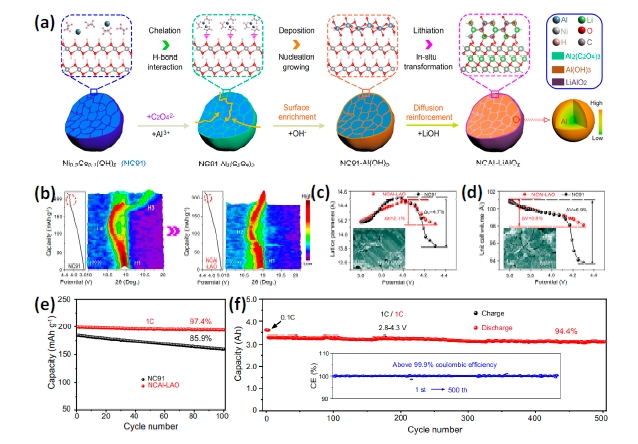
图12 (a)草酸辅助Al3+向Ni0.9Co0.1(OH)2表面均匀沉积、锂化烧结形成Al掺杂-LiAlO2包覆LiNi0.9Co0.1O2材料(NCAl-LAO)示意图;充电过程(b)NC91原样与NCAl-LAO样品的原位XRD图、(c)晶胞参数c变化、(d)晶胞体积V变化、(e)半电池循环性能对比、(f)全电池循环性能[128]Fig. 12 (a)Schematic illustration of synchronous gradient Al-doped and LiAlO2-coated LiNi0.9Co0.1O2 materials; During charging, evolution of (b) (003) peaks from in situ XRD patterns for NC91 and NCAl-LAO, (c)lattice parameter c, and (d)unit cell volume and insets show cross-sectional SEM images of electrodes after 100 cycles; cycling performance of (e)half cell and (f)NCAl-LAO/graphite full cells[128]. Copyright 2021, Springer Nature |
4.3 核壳和梯度材料设计

图13 (a)内核晶粒紧密团聚,外壳晶粒径向排列的LiNi0.8Mn0.1Co0.1O2核壳材料[135]、(b)设计的Ni含量一定,Co、Mn含量渐变的球形高镍材料[138]Fig. 13 (a) LiNi0.8Mn0.1Co0.1O2 materials consisting of a compacted core and an active-plane-exposing shell[135], Copyright 2019, American Chemical Society. (b)Spatial element distributions of Ni (red), Mn (green) and Co (blue) for the designed concentration gradient Ni-rich cathode materials [138]. Copyright 2021, Springer Nature |
4.4 单晶材料设计
图14 (a)多晶和单晶材料理化性质对比[146]、(b)多晶前驱体烧结过程中单晶颗粒边缘融合生长机理图[144]、(c)高镍材料烧结随温度的相变示意图[145]、(d)单晶材料脱Li+时Li+浓度分布不均引起的晶格差异[148]Fig. 14 (a)Comparison between polycrystalline and single grains in physicochemical properties[146], Copyright 2017, John Wiley and Sons, (b)Mechanism of fusion and growth of single grains during polycrystalline precursors sintering[144], Copyright 2023, John Wiley and Sons, (c)Evolution of structure and phase of Ni-rich cathode materials with increasing temperature[145], Copyright 2016, John Wiley and Sons, (d)Lattice mismatch caused by uneven Li+ concentration distribution during Li+ deintercalation[148]. Copyright 2021, American Chemical Society |