


1 引言
2 理论计算方法
2.1 基于密度泛函理论的量子化学计算
2.2 分子动力学模拟
3 电解液组分的静态化学性质
3.1 配位络合物中的结合能
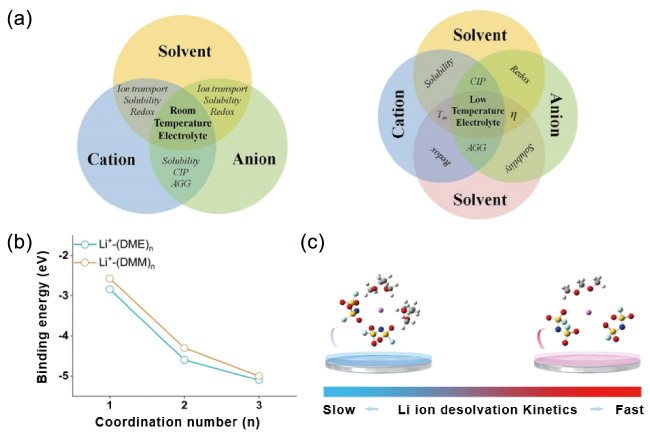
图1 (a) 室温(左)和低温(右)电解液中的基本相互作用及其结构-功能关系示意图[41];(b) 不同配位数下,DME和DMM与Li+的结合能[44];(c) 1 mol/L LiFSIDME电解液(左)和1 mol/L LiFSIDMM电解液(右)中Li金属表面Li+脱溶过程示意图[44]Fig. 1 (a) Schematic of fundamental interaction in room-temperature (left) and low-temperature (right) electrolytes, respectively, and related structure-function relationship[41]. Copyright 2023, John Wiley and Sons. (b) The plot of binding energies of Li+ solvated byDME andDMM as a function of coordination number[44]. (c) Schematic diagram of the Li+ desolvation process at Li metal surface in 1 mol/L LiFSIDME (left) and 1 mol/L LiFSIDMM (right) electrolyte[44]. Copyright 2022, John Wiley and Sons |
3.2 电解液组分的氧化还原稳定性
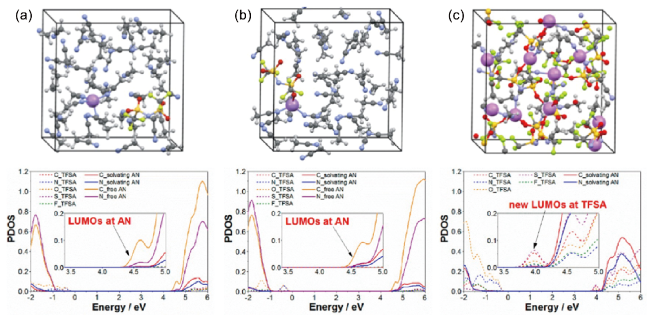
图2 在(a, b) 稀释和(c) 高浓度LiTFSA AN溶液上的量子力学DFT-MD模拟中,使用的模拟盒子和预测的态密度(PDOS)。所示结构是平衡轨迹的快照。对于稀溶液,考虑了LiTFSI盐的两种情况。PDOS剖面中的插图是传导带最低能级边缘的放大图[49]Fig. 2 Supercells used and projected density of states (PDOS) obtained in quantum mechanicalDFT-MD simulations on (a and b) dilute and (c) super-concentrated LiTFSA AN solutions. The illustrated structures are the snapshots in equilibrium trajectories. For a dilute solution, both situations of LiTFSI salt were considered. Insets in the PDOS profiles are magnified figures of the lowest energy-level edge of the conduction band[49]. Copyright 2014, American Chemical Society |
3.3 电解液组分的静电势
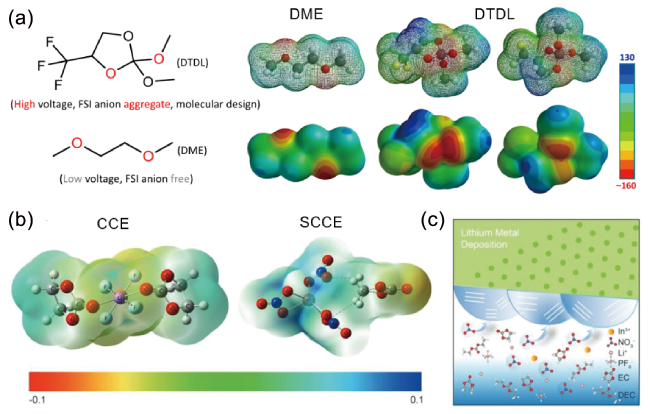
图4 (a)DME和DTDL的分子结构和静电势[60];(b) SCCE和CCE电解液中代表性溶剂化结构的静电势;(c) SCCE电解液中SEI形成示意图[61]Fig. 4 (a) Molecular structures and electrostatic potential ofDME andDTDL[60]. Copyright 2022, Springer Nature. (b) Electrostatic potential of representative solvation structures in SCCE and CCE electrolytes. (c) Schematic diagram of the formed SEI in SCCE electrolyte[61]. Copyright 2020, John Wiley and Sons |
4 电解液体相和电极-电解液界面的微观结构与性质
4.1 体相电解液的溶剂化结构
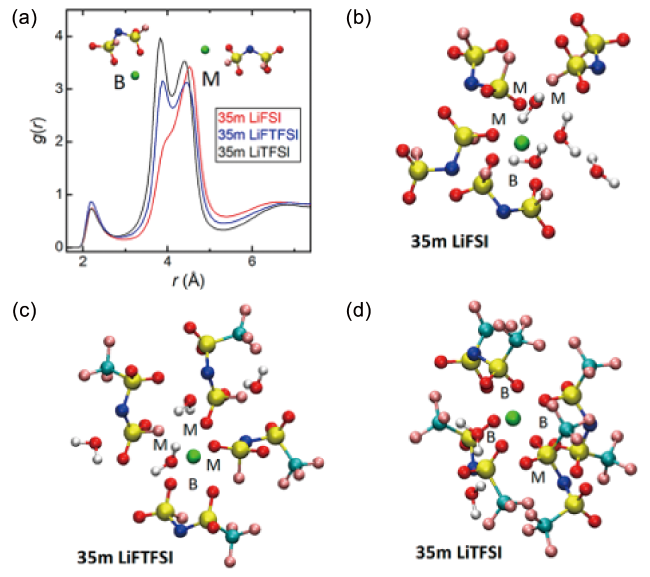
图5 (a) Li+与不同阴离子中N原子之间的径向分布函数;(b~d) 35 m LiFSI、LiFTFSI、LiTFSI水系电解液代表性溶剂化结构的MD模拟快照[65]Fig. 5 (a) Radial distribution function between Li+ and N atom in different anion. (b~d) MD simulation snapshots of representative solvation structures in 35 m LiFSI, LiFTFSI, LiTFSI aqueous electrolytes[65]. Copyright 2020, American Chemical Society |

4.2 体相电解液的离子电导率
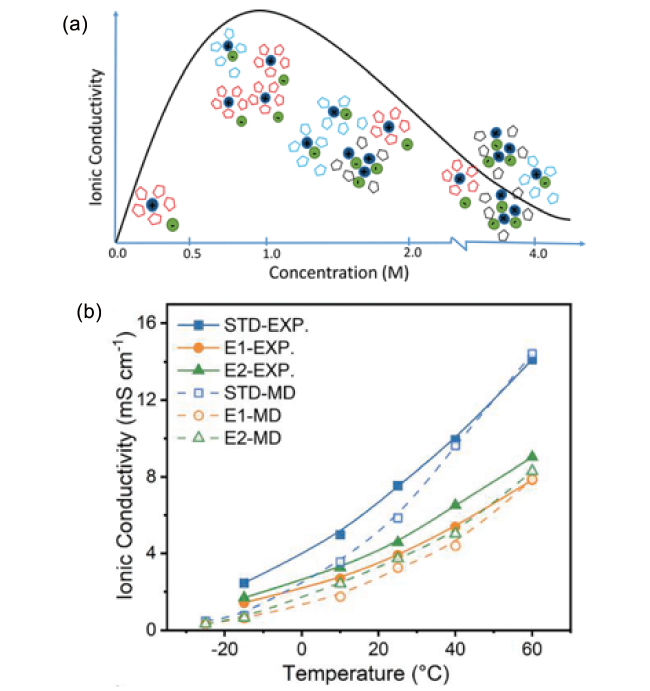
图7 (a) 离子电导率与盐浓度的关系[87];(b) 不同温度下(-15~60℃)电解液离子电导率的实验测试值和理论计算值[88]Fig. 7 (a) The relationship between ionic conductivity and salt concentration[87]. Copyright 2018, American Chemical Society. (b) Experimental and theoretical values of ionic conductivity of electrolyte at different temperatures (-15~60℃)[88]. Copyright 2022, Elsevier |
4.3 体相电解液的介电常数
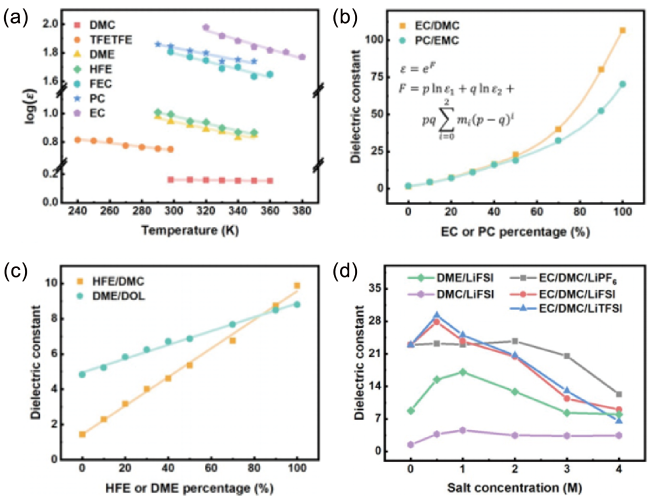
图8 (a) 温度对溶剂介电常数的影响;(b) 具有强分子间相互作用的混合溶剂的介电常数;(c) 具有弱分子间相互作用的混合溶剂的介电常数;(d) 浓度对电解液介电常数的影响[32]Fig. 8 (a) Effects of temperature on the dielectric constant of solvents;(b) dielectric constant of mixed solvents with strong intermolecular forces;(c) dielectric constant of mixed solvents with weak intermolecular forces;(d) effects of concentration on the dielectric constant of electrolytes[32]. Copyright 2021, John Wiley and Sons |
4.4 电极-电解液界面微观结构与性质

图9 (a) 1 mol/L LiFSIDME和(b) 1 mol/L LiFSI/LiNO3DME在0.5 V的正极表面内亥姆霍兹界面区局部结构[92],在213 K下,(c) 1 mol/L LiFSIDOL/DME和(d) 1 mol/L LiFSIDEE中Li+的去溶剂化过程示意图[93]Fig. 9 Local structure of inner-Helmholtz interfacial regions at cathode surface in (a) 1 mol/L LiFSIDME and (b) 1 mol/L LiFSI/LiNO3DME at 0.5 V[92]. Copyright 2022, Springer Nature. Visualized Li+ desolvation process at 213 K in (c) 1 mol/L LiFSIDOL/DME and (d) 1 mol/L LiFSIDEE[93]. Copyright 2022, American Chemical Society |