


1 引言
2 聚集诱导发光材料
2.1 AIE小分子
2.1.1 9,10-二苯乙烯基蒽
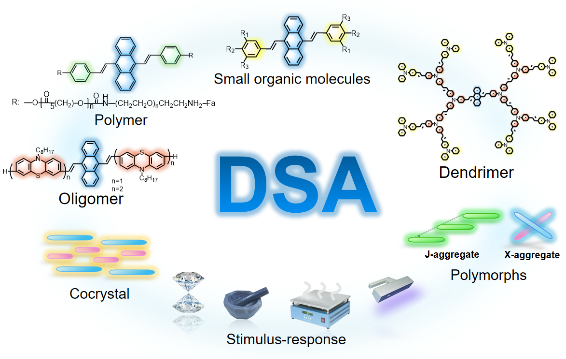
2.1.1.1 DSA材料
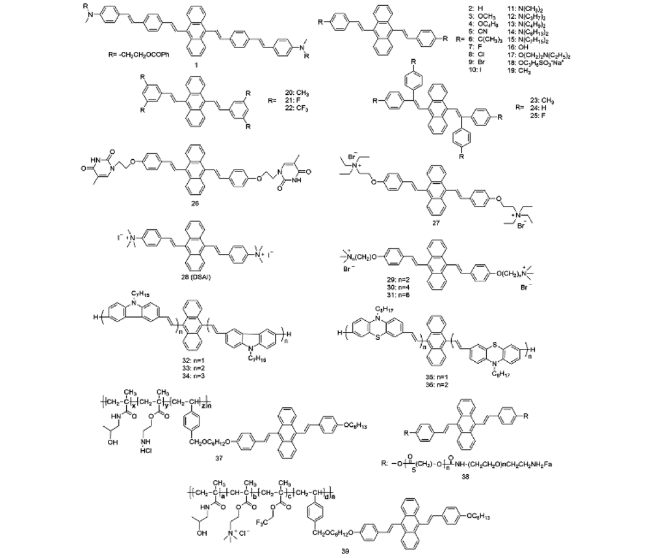
2.1.1.2 DSA聚集态结构与功能

图3 (a) 蝴蝶型BDPVA单晶的荧光图像以及晶体中的两种分子构象[30]。(b) BDFVA的G相和B相晶体及对应的分子堆积[31]。(c) BDTVA晶体中分子的单轴取向以及光波导和偏振特性[34]Fig. 3 (a) Fluorescence image of butterfly-like BDPVA single crystal and corresponding two conformational structures of BDPVA[30]. (b) Crystal images of G-phase and B-phase and corresponding molecular packing of BDFVA[31]. (c) The uniaxial orientation of the molecules in the BDTVA crystal and corresponding waveguide and polarization performance[34] |
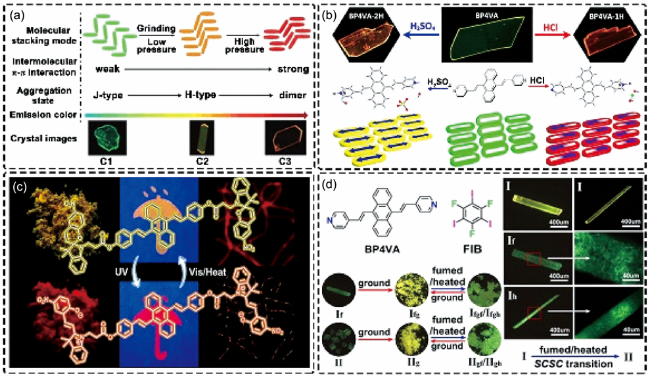
图4 (a) 压力刺激下BP2VA不同聚集态的堆积模式及发光颜色[37]。(b) 不对称质子化的BP4VA-1H和对称质子化的BP4VA-2H晶体的荧光图像以及分子堆积[45]。(c) DSA-2SP在紫外光和热的交替刺激下分子构型、荧光颜色的可逆改变以及防伪颜料和超分辨成像应用。(d) BP4VA-FIB共晶的多晶型以及多重外界刺激下晶体到晶体(SCSC)的相变以及发光颜色转变[49]Fig. 4 (a) The Stacking modes and corresponding emission colors of different aggregation states of BP2VA under pressure stimulation[37]. (b) Fluorescence images of asymmetrically protonated BP4VA-1H and symmetrically protonated BP4VA-2H crystals and corresponding molecular packing in the crystals[45]. (c) DSA-2SP molecular configuration, reversible change of fluorescence color, anti-counterfeiting pigments and super-resolution imaging applications under alternating UV light and heat stimulation. (d) Polymorphs of BP4VA-FIB cocrystal and the crystal-to-crystal (SCSC) transition and corresponding changes of fluorescence color under multiple external stimulation[49] |
2.1.2 四苯基苯
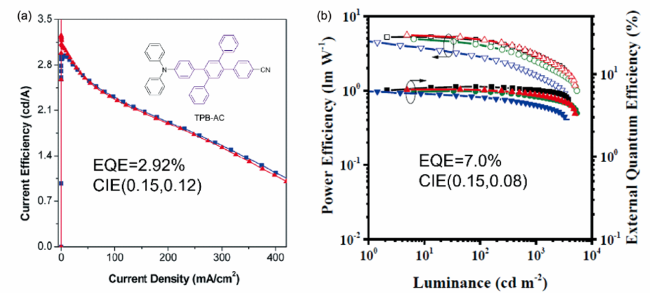
图5 (a) TPB-AC基器件的电流效率-电压曲线,器件结构:Ⅰ: ITO/NPB (60 nm)/TPB-AC (20 nm)/TPBi (40 nm)/LiF (1 nm)/Al; Ⅱ: ITO/NPB (40 nm)/TPB-AC (20 nm)/TPBi (40 nm)/LiF (1 nm)/Al[55]。 插图: TPB-AC的化学结构。 (b) 优化器件的功率效率-外量子效率-亮度曲线(P-EQE-L)。器件结构:ITO/HAT-CN (5 nm)/TAPC (50 nm)/TCTA (5 nm)/TPB-AC (20 nm)/ETLs (40 nm)/LiF (1 nm)/Al (120 nm), Bphen和BCP是ETLs[56]Fig. 5 (a) Current efficiency versus voltage plots of the TPB-AC based devices. Device configuration: Ⅰ: ITO/NPB (60 nm)/TPB-AC (20 nm)/TPBi (40 nm)/LiF (1 nm)/Al; Ⅱ: ITO/NPB (40 nm)/TPB-AC (20 nm)/TPBi (40 nm)/LiF (1 nm)/Al[55]. Insert: chemical structures of TPB-AC. (b) Power and external quantum efficiencies as a function of luminance of the resulting devices. Device configuration: ITO/HAT-CN (5 nm)/TAPC (50 nm)/TCTA (5 nm)/TPB-AC (20 nm)/ETLs (40 nm)/LiF (1 nm)/Al (120 nm), Bphen or BCP is chosen for ETLs[56] |
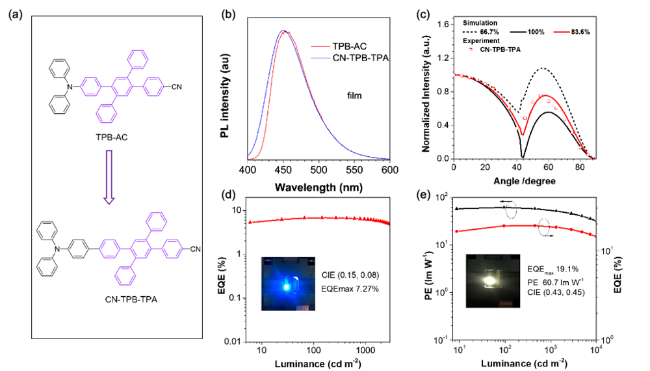
图6 (a) 深蓝光AIEgens。 (b) CN-TPB-TPA的UV-vis光谱(THF溶液)和光致发光光谱(薄膜态)。(c) CN-TPB-TPA 30 nm薄膜在极化光下的角度依赖光谱(448 nm)。(d) 最优深蓝光器件的外量子效率-亮度曲线。(e) 最优混合白光器件的功率-外量子效率-亮度曲线[54]Fig. 6 (a) Chemical structures of deep blue AIEgens. (b) UV-vis (THF solution) and photoluminescence (PL, films) spectra of CN-TPB-TPA. (c) Angle-dependent PL intensity of p-polarized light from the 30 nm-thick films at 448 nm for CN-TPB-TPA. (d) External quantum efficiencies as a function of luminance of the resultant deep blue OLEDs. (e) Power and external quantum efficiencies as a function of luminance of the resultant hybrid white OLEDs[54] |
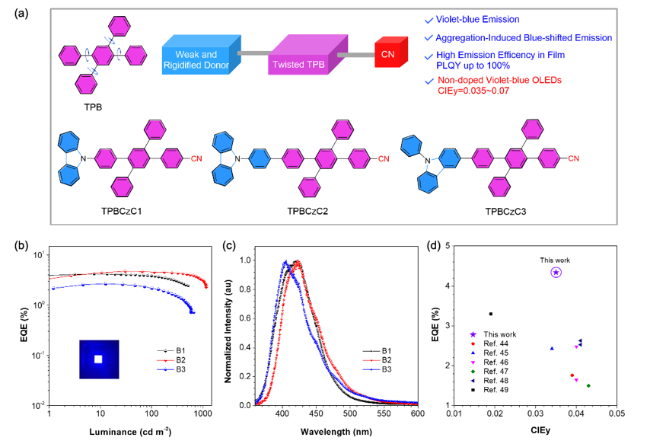
图7 (a) 蓝紫光AIEgens的设计原理和化学结构。(b) 最优非掺杂蓝紫光OLEDs的外量子效率-亮度曲线。插图:器件B1的发光。(c) 器件B1~B3在5 V下的电致发光光谱。(d) 基于荧光材料制备的CIEy<0.046的蓝紫光OLEDs的最大EQE值。器件B1: EBL:mCP和EML:TPBCzC1; B2: EBL:TCTA和EML:TPBCzC2; B3: EBL:TCTA和EML:TPBCzC3[52]Fig. 7 (a) Design principle, chemical structures of violet-blue AIEgens. (b) External quantum efficiencies as a function of luminance of the resultant non-doped violet-blue OLEDs with different EBLs and emitters. Inset: the emission of device B1. (c) Electroluminescence (EL) spectra of B1-B3 at 5.0 V. (d) Maximum EQE values of the representative violet-blue OLEDs with CIEy smaller than 0.046 based on fluorescent materials. Device B1: EBL:mCP and EML:TPBCzC1; B2: EBL:TCTA and EML:TPBCzC2; B3: EBL:TCTA and EML:TPBCzC3[52] |
2.1.3 四苯基吡嗪
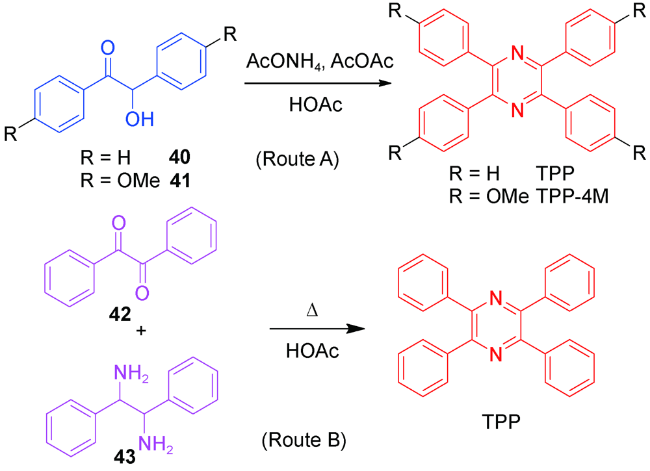
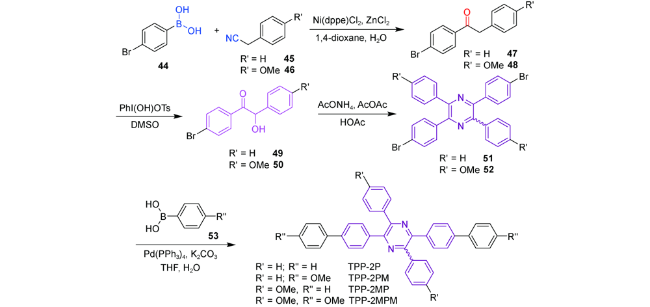
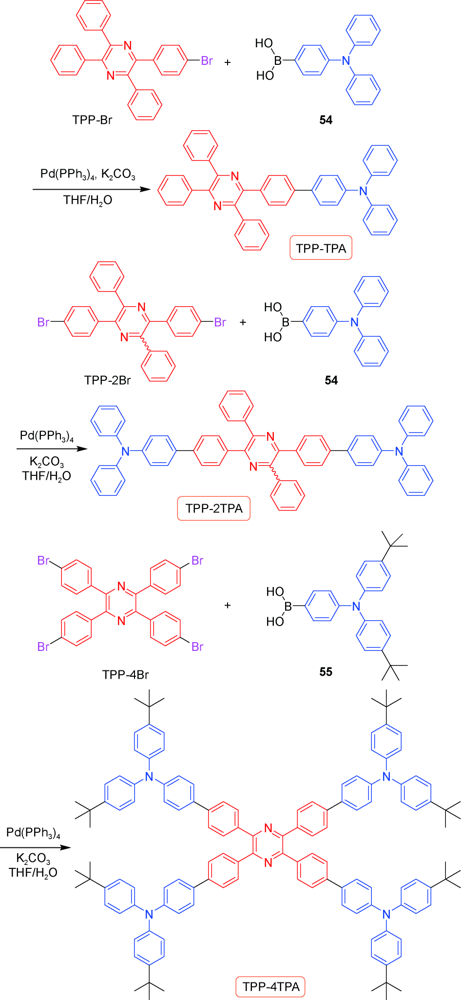
2.1.3.1 TPP的合成
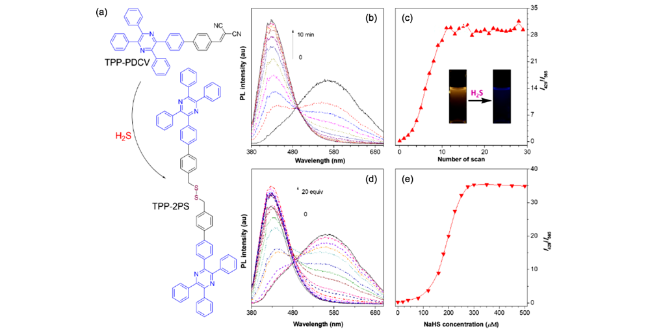
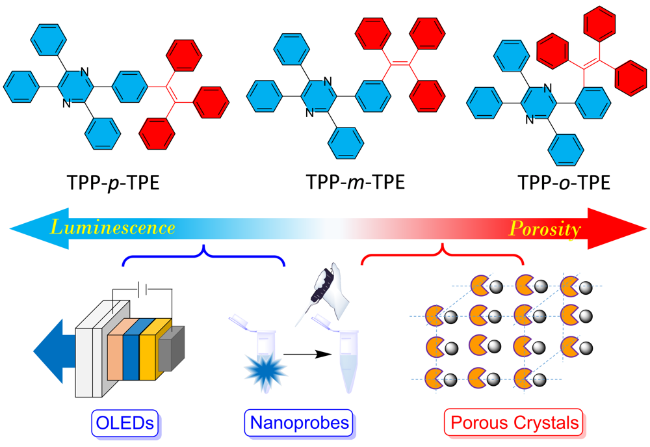
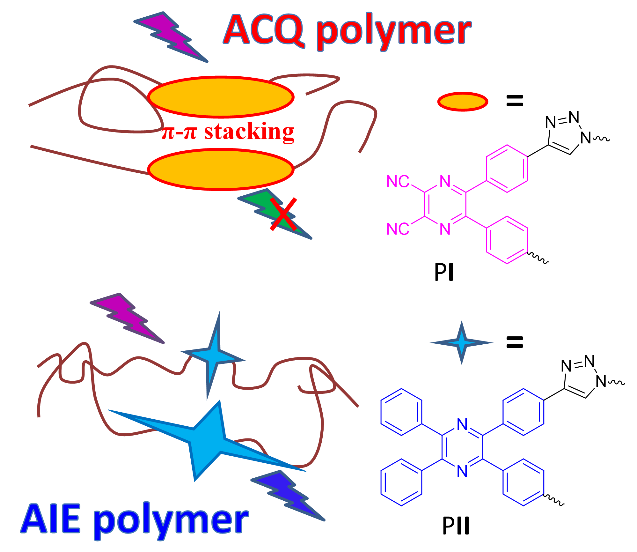
2.1.3.2 TPP衍生物的应用

2.1.4 多芳基并吡咯
2.1.4.1 分子结构-光物理性能关系
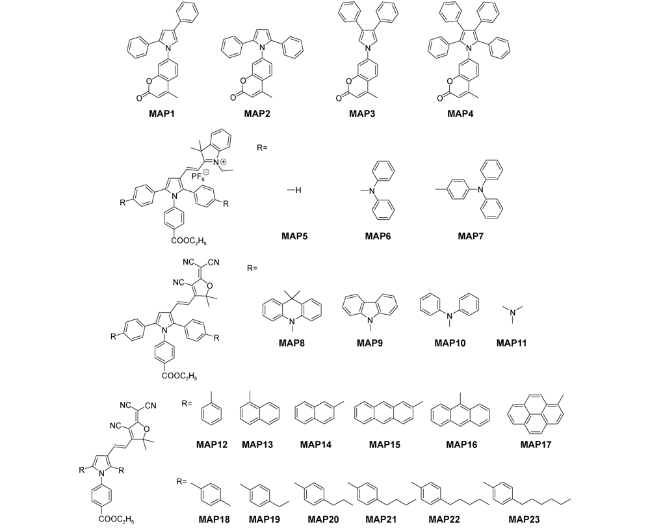
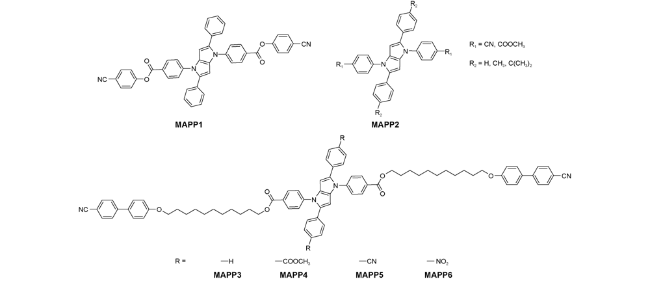
2.1.4.2 应用
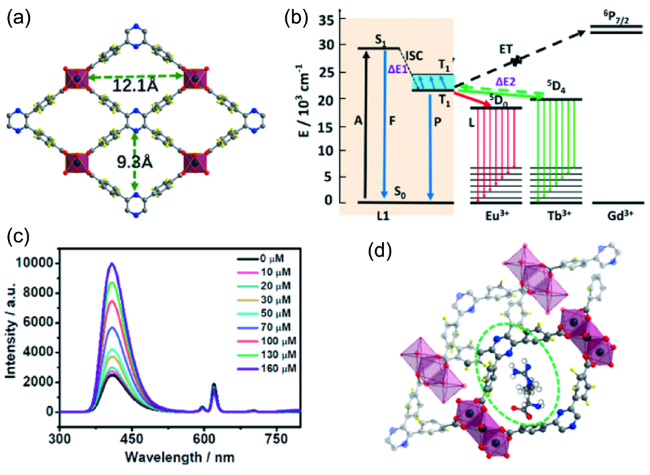
图18 4T1荷瘤小鼠的体内成像和肿瘤治疗能力。(a) 荷瘤小鼠注射MAP4-FE NPs后的肿瘤部位PA图像(1.5 mg·mL-1, 200 μL, n=3, 660 nm, 0.5 W·cm-2, 10 min,300 J·cm-2)。(b) (a)中肿瘤部位归一化PA强度曲线随时间的对应关系。(c) 在激光辐照下肿瘤控制组和注射MAP4-FE NPs组肿瘤检测的温度变化(9 h后,老鼠用激光辐照(660 nm, 0.5 W·cm-2, 10 min,300 J·cm-2)。(d) 将4T1荷瘤小鼠分为4组(对照组不给予任何治疗,一组仅给予0.5 W·cm-2激光照射,一组仅给予MAP4-FE NPs,最后一组给予MAP4-FE NPs和0.5 W·cm-2激光照射)。各组治疗后肿瘤体积的变化,插入物显示治疗14天后的肿瘤图像(每两天记录小鼠肿瘤体积和体重)。(e) 不同组肿瘤小鼠的照片。(f) 各组治疗后肿瘤组织的H&E和TUNEL染色分析[81]Fig. 18 In vivo imaging and tumor therapy capacity of 4T1 tumor-bearing mice. (a) PA images of the tumor sites from a representative tumor-bearing mouse post injection of MAP4-FE NPs (1.5 mg·mL-1, 200 μL, n=3, 660 nm, 0.5 W·cm-2, 10 min, 300 J·cm-2). (b) Correspondence to the normalized PA intensity curve of the tumor sites in (a) over time. 4T1 tumor-bearing mice were divided into four groups (control group without any treatment, 0.5 W·cm-2 laser irradiation only, MAP4-FE NPs only, and MAP4-FE NPs with 300 J·cm-2 laser). (c) Temperature changes in tumors under laser irradiation after administration of Control or MAP4-FE NPs (nine hours after the injection, the mice were irradiated with a laser (660 nm, 0.5 W·cm-2, 10 min, 300 J·cm-2), and the temperature of the tumor was detected by a thermal imager). (d) The relative tumor volume changes after various treatments, and the inset shows the tumor images after 14 days of treatment (the tumor volumes and body weights of the mice were recorded every two days). (e) Photos of tumor-bearing mice from different groups. (f) H&E and TUNEL staining analyses of tumor tissues after various treatments (color online)[81] |

图19 (a) MAPP7的衍生物。(b) 以0.5 ℃·min-1的降温速率将MAPP7-C6降温至103 ℃和MAPP7-C12降温至87 ℃时观察到的液晶织构,左下角的插图是液晶相在紫外灯下的照片。(c~e) MAPP7-C6和MAPP7-C12液晶薄膜的2D GIWAXS图;MAPP7-C6和MAPP7-C12的2D GIWAXS散射图样在平行和垂直方向的信号强度。(f~h) TPPP-C6和TPPP-C12在液晶相的分子排列模型[82]Fig. 19 (a) Derivatives of MAPP7. (b) The liquid crystal texture observed when MAPP7-C6 is cooled to 103 ℃ and MAPP7-C12 is cooled to 87 ℃ at a cooling rate of 0.5 ℃·min-1. The illustration in the lower left corner is a photo of the liquid crystal phase under ultraviolet light. (c~e) 2D GIWAXS images of MAPP7-C6 and MAPP7-C12 liquid crystal films; signal intensity of 2D GIWAXS scattering patterns of MAPP7-C6 and MAPP7-C12 in parallel and vertical directions. (f~h) Molecular arrangement model of TPPP-C6 and TPPP-C12 in liquid crystal phase[82] |
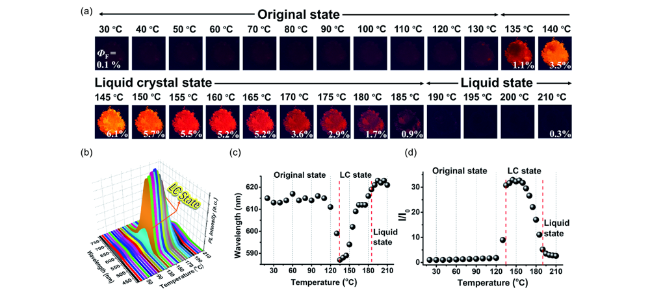
图20 (a) TPPP-NO2在365 nm紫外灯下从30 ℃加热到210 ℃过程中的发光照片。(b) TPPP-NO2从20 ℃加热到210 ℃过程中的变温荧光光谱图。(c, d) (b) 中荧光发射波长和荧光强度的变化情况,I0: 20 ℃时TPPP-NO2的荧光强度[82]Fig. 20 (a) Photos of TPPP-NO2 during the heating process from 30 to 210 ℃ under 365 nm UV light; (b) temperature-dependent fluorescence spectra during the heating process from 20 to 210 ℃; (c) the corresponding PL wavelength maximum shift behavior and (d) PL intensity change behavior of (b), I0:Fluorescence intensity of TPPP-NO2 at 20 ℃[82] |
2.2 AIE共晶体系
2.2.1 AIE共晶
2.2.1.1 氢键/卤键AIE共晶
2.2.1.2 电荷转移AIE共晶
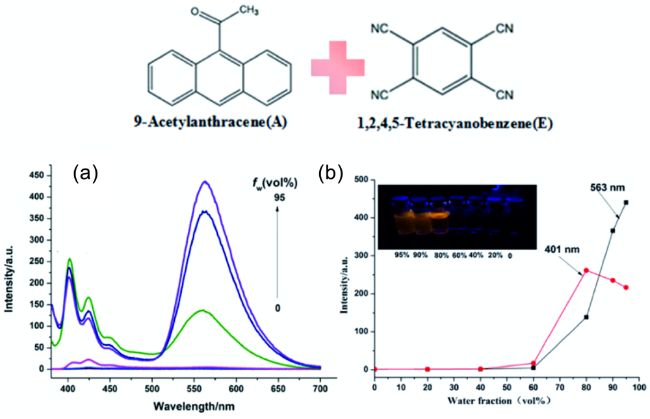
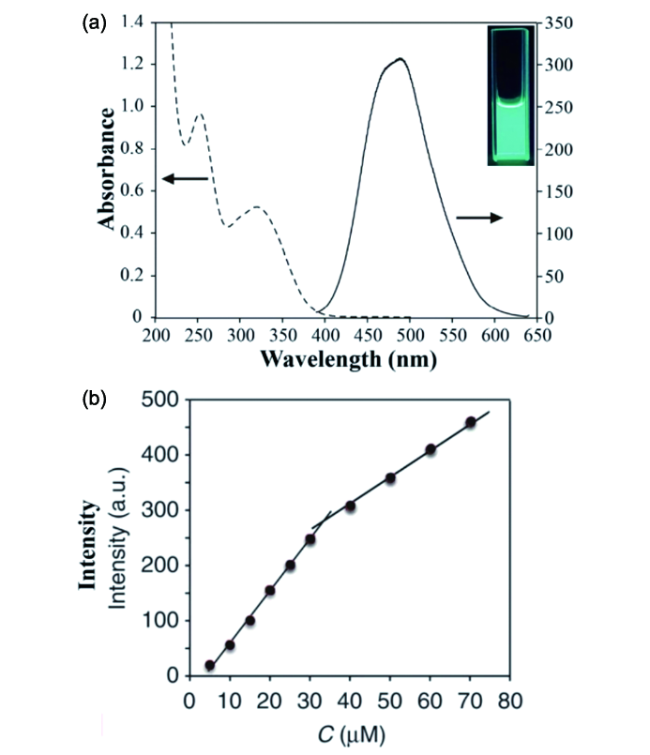
图22 (a) 9-乙酰基蒽-1,2,4,5-四氰基苯共晶(AE)在不同水含量的丙酮溶液下的荧光发射光谱;(b) AE共晶在丙酮-水溶剂对中荧光强度与水体积分数关系图,插图是在365 nm紫外灯下拍摄样品聚集诱导现象照片[104]Fig. 22 (a) PL spectra of AE in acetone-H2O mixtures with different water fractions (fw); (b) plots of fluorescence intensity in acetone-H2O solutions, the inset in (b): photos of acetone-H2O mixtures (fw=0-95%) taken under illumination of a 365 nm UV lamp[104] |
2.2.1.3 其他类型AIE共晶
2.2.2 AIE共晶的应用
2.2.2.1 药物传输和释放
2.2.2.2 生物成像
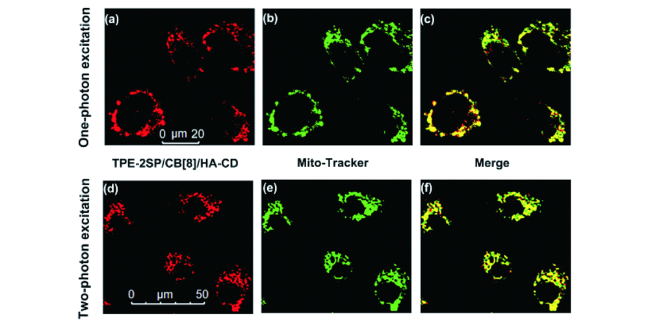
图24 A549细胞的共聚焦显微镜图:(a) 405 nm激发下的TPE 2SP/CB[8]/HA-CD ([TPE-2SP]=0.005×10⁻³ m)图;(b) 线粒体绿色荧光探针和(a, b)的合并图(c);A549细胞的双光子显微镜图:(d) 840 nm激发下的TPE 2SP/CB[8]/HA-CD ([TPE-2SP]=0.005×10⁻³ m)图;(e) 线粒体绿色荧光探针和(d, e)的合并图(f)[110]Fig. 24 CLSM images of A549 cells incubated with (a) TPE 2SP/CB[8]/HA-CD ([TPE-2SP]=0.005×10⁻³ m) excited at 405 nm. (b) Mito-Tracker Green and (c) the merged image of (a, b); two-photon microscopic images of A549 cells incubated with (d) TPE-2SP/CB[8]/HA-CD ([TPE-2SP]=0.005×10⁻³ m) excited at 840 nm. (e) Mito-Tracker Green and (f) the merged image of (d, e)[110] |
2.2.2.3 光学传感
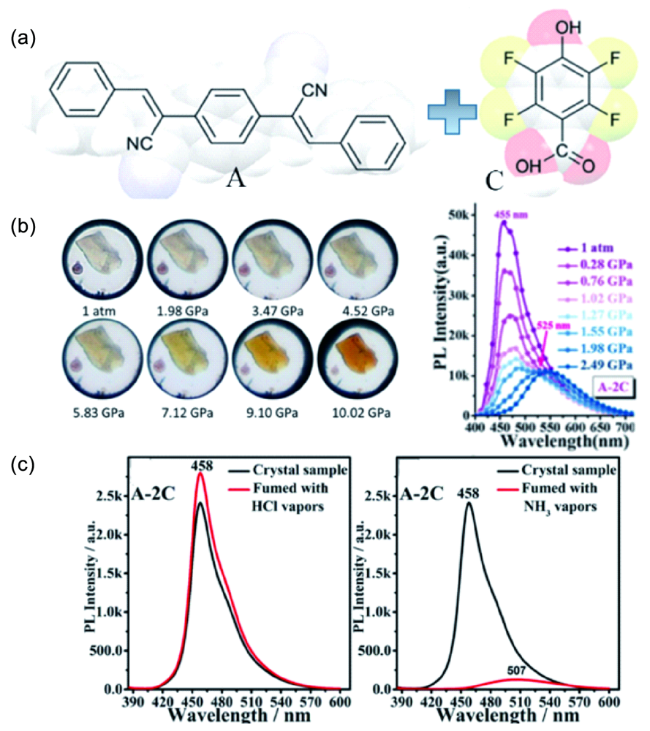
图25 (a) 组装单元4-双(1-氰基-2-苯乙烯基)苯(A)和2,3,5,6-四氟-4-羟基(C)的分子结构式;(b) 共晶A-2C的压致变色图以及光谱图;(c) 共晶A-2C在酸碱蒸气熏蒸前后的光谱图[114]Fig. 25 (a) Molecular structures of co-crystal components: 4-bis(1-cyano-2-phenylethenyl)benzene (A) and 2,3,5,6-tetrafluoro-4-hydroxy-benzoic acid (C); (b) photographs and fluorescence spectra of the A-2C cocrystal as gradually increasing hydrostatic pressures; (c) fluorescence spectra for A-2C sample before (black lines) and after (red lines) fuming with HCl vapor (left) and NH3 vapor (right), respectively[114] |
2.3 AIE聚合物
2.3.1 生物成像
2.3.1.1 选择性成像
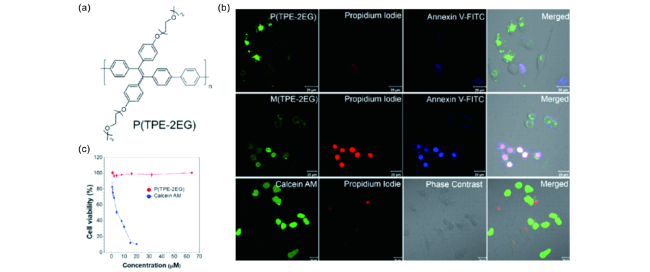
图26 活细胞选择性成像:(a) P(TPE-2EG)结构式;(b) 用双氧水处理后的HeLa细胞与P(TPE-2EG), M(TPE-2EG)及calcein AM共培养之后的CLSM成像图;(c) P(TPE-2EG)和calcein AM的细胞毒性实验[125]Fig. 26 Selective viable labeling. (a) Chemical structure of P(TPE-2EG); (b) CLSM images of HeLa cells incubated with P(TPE-2EG), M(TPE-2EG) and calcein AM after treatment with H2O2, followed by staining with Annexin V-FITC and PI; (c) Cell viability of HeLa cells incubated with different concentrations of P(TPE-2EG) and calcein AM[125] |
2.3.1.2 响应性成像

图27 CO2响应性:(a) 嵌段聚合物对于CO2及N2响应示意图;(b) 细胞内CO2响应成像示意图;(c) 不同细胞系与嵌段聚合物的CLSM成像图[133]Fig. 27 CO2 responsiveness. (a) Schematic illustration of the response process of block polymer with CO2 and N2; (b) Schematic illustration of the mechanism for cell imaging; (c) CLSM images of 16HBE human bronchial epithelial cells, GES-1 human gastric mucosa epithelial cells, HeLa human cervical cancer cells, 5-8F nasopharyngeal cancer cells, and CNE1 nasopharyngeal cancer cells after incubation with the block polymer[133] |
2.3.2 生物诊疗
2.3.2.1 光动力治疗
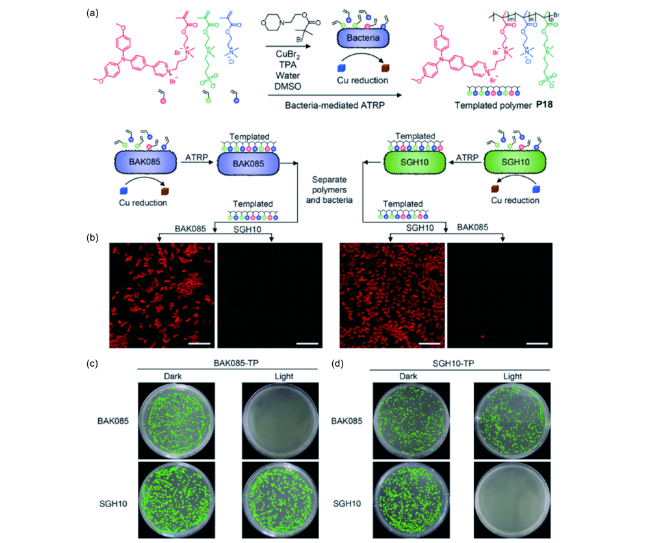
图28 以细菌为模板构建聚合物。(a) 模板聚合物合成路线;(b) 分别以BAK085和SGH10为模板构建模板聚合物示意图及对应的成像结果;(c) 以BAK085和SGH10为对应模板聚合物的平板杀菌实验结果[138]Fig. 28 Bacterium-templated polymer; (a) Synthetic route to templated polymer; (b) Schematic illustration of the templated polymer grown in a suspension of K. pneumoniae (BAK085 and SGH10), and the templated polymers were collected for BAK085 and SGH10 CLSM imaging; (c) Plate photographs of the colonies formed of BAK085 and SGH10 on LB agar in the absence or presence of white light irradiation after incubation with templated polymers or mismatched polymers[138] |
2.3.2.2 原位诊疗
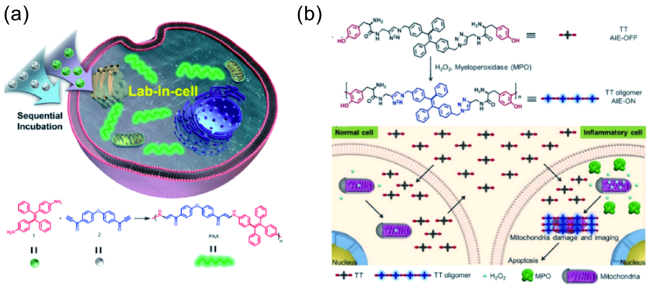
图29 (a) 基于炔胺点击聚合的细胞内聚合示意图[141];(b) 细胞内聚合。H2O2存在情况下过氧物酶催化的TT聚合;基于TT的细胞内聚合用于选择性成像及抑制示意图[142]Fig. 29 (a) Illustration of the intracellular spontaneous amino-yne click polymerization, and synthetic route to poly(β-aminoacrylate) (color online)[141]; (b) Intracellular polymerization. Peroxidase-catalyzed oligomerization of TT in the presence of H2O2; selective imaging and inhibition of inflammatory cells after incubation of cocultured cells with TT[142] |
2.3.2.3 药物/核酸递送
2.4 AIE金属有机配合物
2.4.1 具有聚集诱导发光的钌(Ⅱ)和铱(Ⅲ)配合物
2.4.1.1 AIE金属配合物发光机理及其设计
2.4.1.2 AIE钌(Ⅱ)配合物
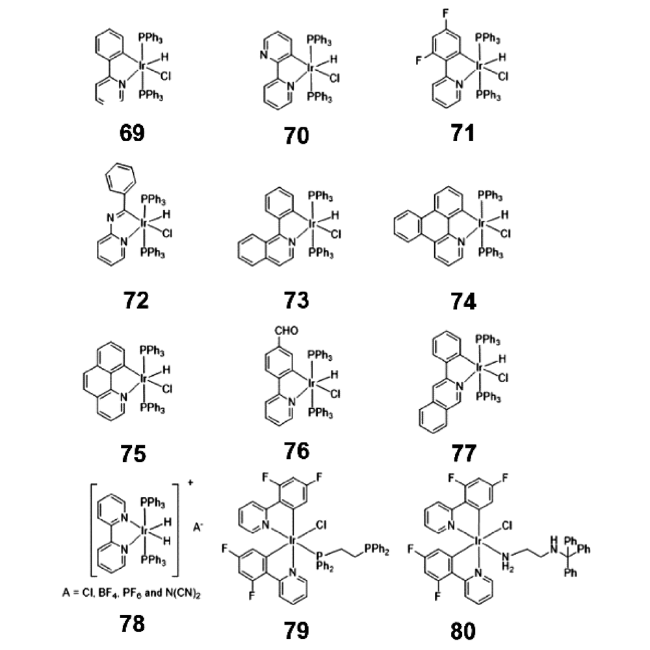
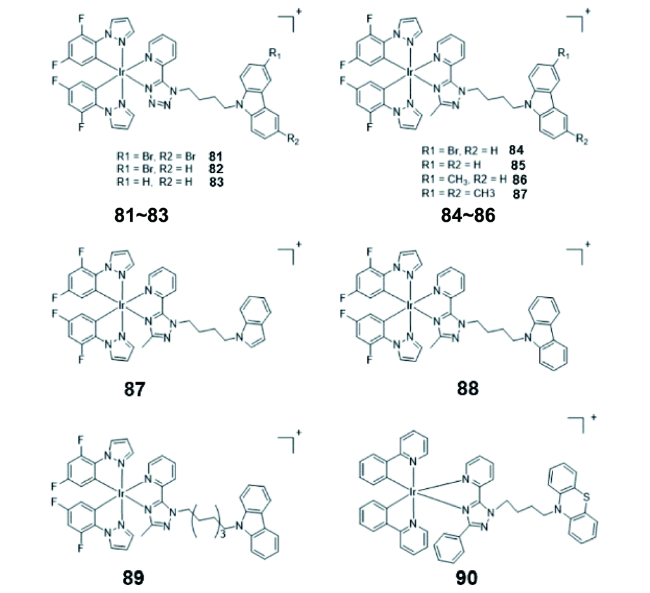
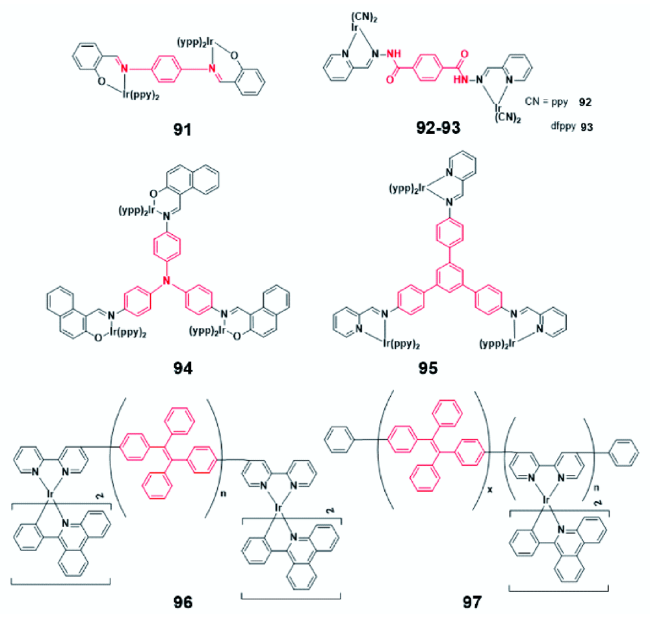
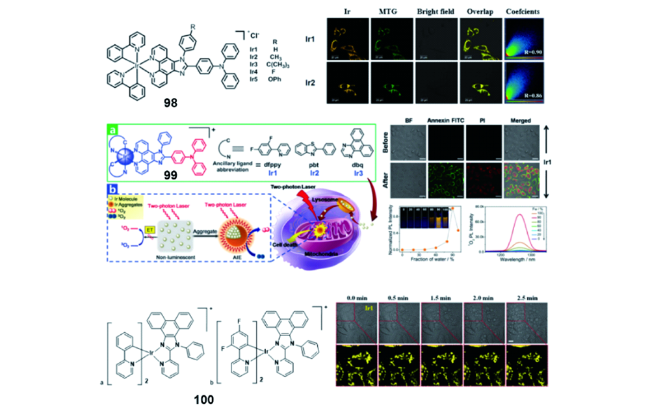
2.4.1.3 AIE铱(Ⅲ)配合物
2.4.2 货币金属团簇
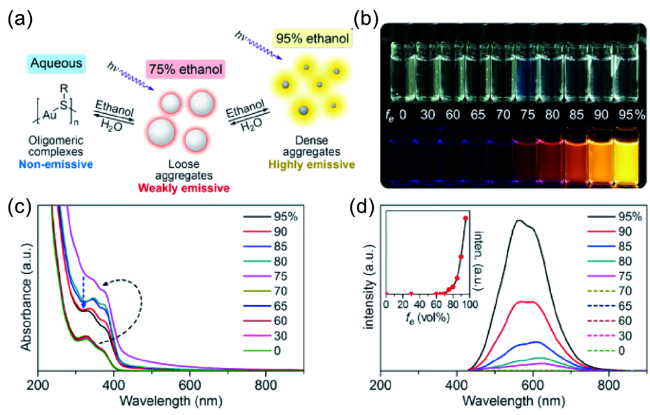
图37 (a) 溶剂诱导AIE性质的示意图。(b) Au(Ⅰ)-硫醇聚合物在不同比例水和乙醇混合溶剂的荧光照片。Au(Ⅰ)-硫醇聚合物在不同体积分数的乙醇中紫外-可见吸收光谱(c)和发射光谱(d)[196]Fig. 37 (a) Schematic of solvent-induced AIE properties of oligomeric gold-thiolate complexes. (b) Photos of gold-thiolate complexes in mixed solvents with different fractions of water under visible and UV light. (c) UV-vis absorption and (d) emission spectra of gold-thiolate complexes in mixed solvents with different fractions of ethanol[196] |
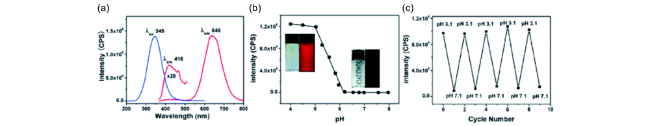
图39 (a) 铜纳米团簇溶液的发射光谱(pH值为2.66);(b) pH值对铜纳米团簇发射强度的影响;(c) 铜纳米团簇在pH值3.1和7.1交替条件下循环切换时的发射强度[199]Fig. 39 (a) Emission spectra of the aqueous copper cluster aggregates (pH 2.66); (b) Plots of emission intensity of the copper clusters against pH values; (c) Emission intensity upon the cyclic switching of the copper clusters under alternating conditions of pH values of 3.1 and 7.1[199] |
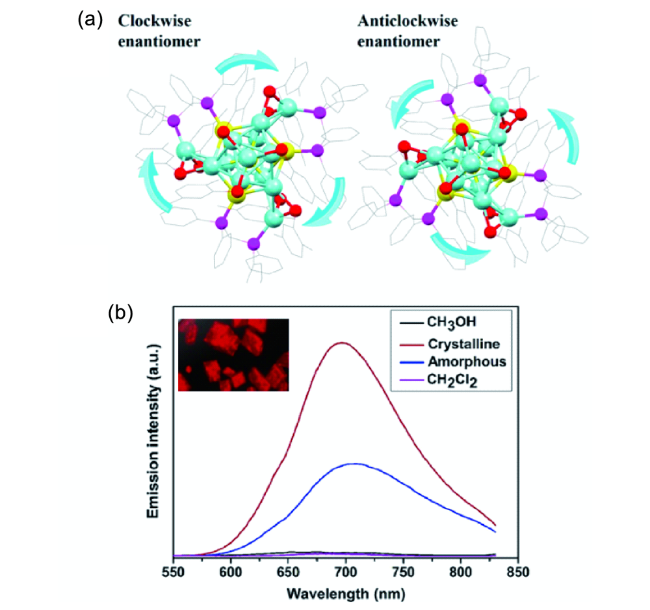

图42 (a) 三苯基膦配体解离-聚集过程中团簇发光、量子产率的变化;(b) 加入不同摩尔比的三苯基膦该团簇溶液的荧光照片[202]Fig. 42 (a) Enhancement of emission intensity and quantum yield induced by the restriction of the ligand dissociation-aggregation process; (b) Photos of Ag29(BDT)12(PPh3)4 upon the addition of different molar ratios of the ligand in solution under UV light[202] |
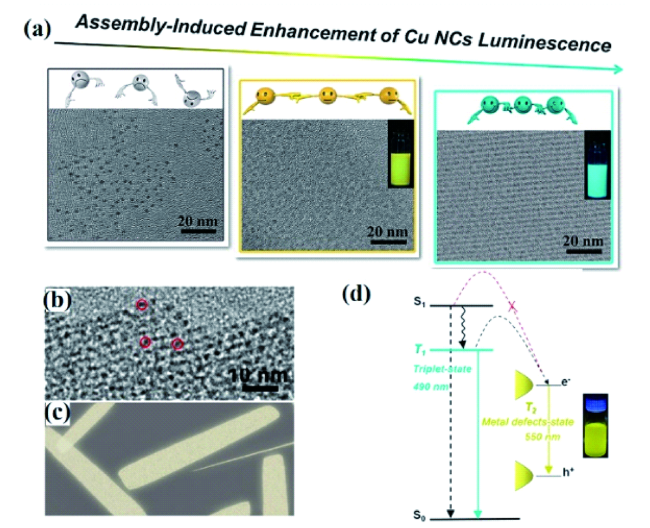
图43 (a) 铜纳米团簇的示意图及相应的透射电子显微镜图[203];(b) 铜纳米团簇自组装纳米片的高分辨透射电子显微镜图;(c) 纳米片的卡通图像;(d) 纳米片的激发态弛豫动力学示意图[204]Fig. 43 (a) Schematic diagram and corresponding TEM images of copper cluster assemblies;(b) high magnification TEM images of copper clusters self-assembly nanosheets;(c) cartoon images of the nanosheets;(d) schematic diagram of the excited state relaxation dynamics of the copper clusters self-assembly nanosheets |
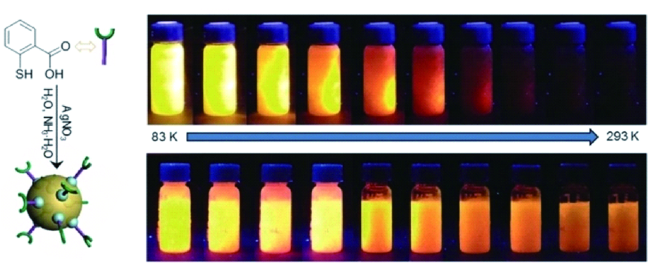
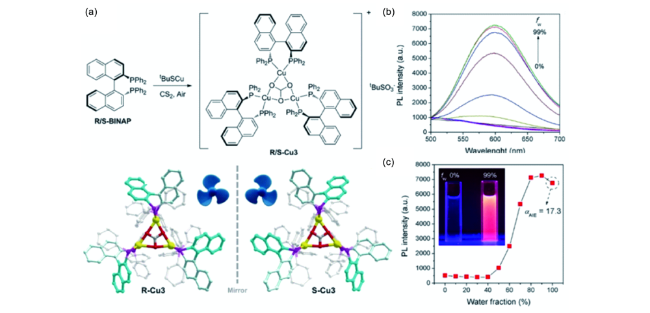
图45 (a) 手性三核铜簇的合成路线及结构;(b) 手性团簇在不同比例二甲基亚砜和水体系中的发射光谱;(c) 手性团簇在605 nm波长处的发射强度与不同比例溶剂体系的关系[207]Fig. 45 (a) Synthetic route and structure of copper clusters;(b) emission spectra of copper clusters in mixed solvents with different fractions of water;(c) emission intensity of copper clusters at 605 nm as a function of water fraction[207] |
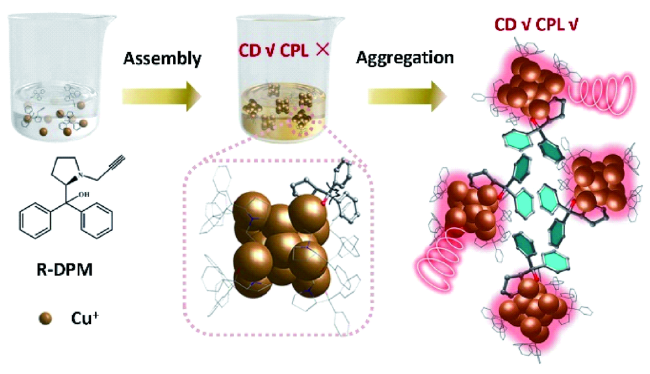
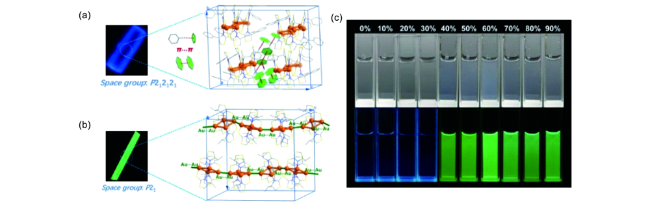
图47 L-[Au4(C9H8S2N)4] (a)和(b) L-{[Au4(C6H10S2N)4]3}n (b)的堆积结构。插图为紫外灯下L-[Au4(C9H8S2N)4]晶体和L-{[Au4(C6H10S2N)4]3}n的数码照片。(c) 可见光和紫外光下L-{[Au4(C6H10S2N)4]3}n在不同体积分数水中的数码照片[209]Fig. 47 (a) Stacking structure of (a) L-[Au4(C9H8S2N)4] and (b) L-{[Au4(C6H10S2N)4]3}n. Insets: luminescent photograph of the single crystals. (c) Photos of L-{[Au4(C6H10S2N)4]3}n in mixed solvents with different fractions of water under visible and UV light[209] |
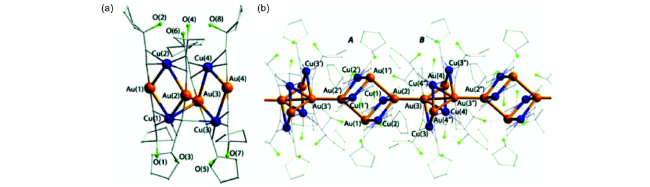
Fig. 48 L-[Au4(C9H8S2N)4] (a)和L-{[Au4(C6H10S2N)4]3}n (b)的堆积结构[213] |
2.4.3 具有AIE性质的超分子金属有机配合物
2.4.3.1 具有AIE性质的金属有机大环
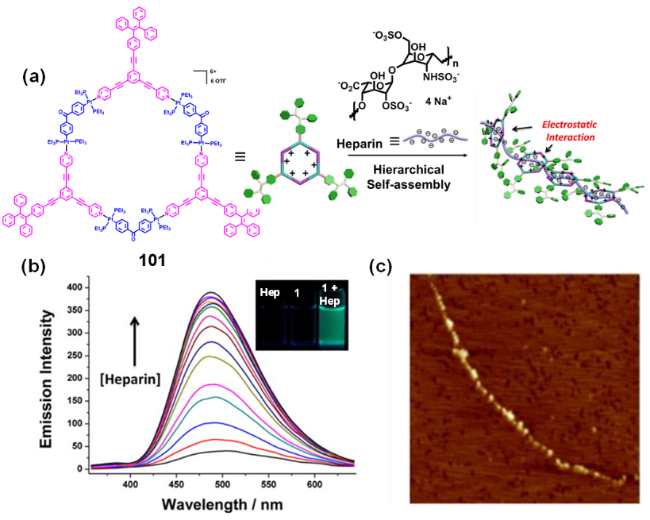
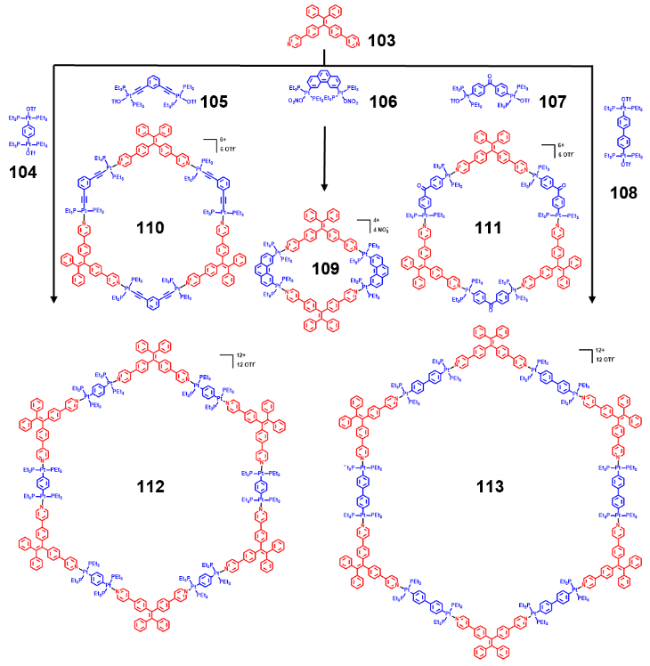
图49 (a) 金属有机大环101和肝素钠可能的结合模式示意图;(b) 金属有机大环101中加入肝素钠的荧光发射光谱; (c) 金属有机大环101肝素钠复合物的AFM图[244]Fig. 49 (a) Schematic showing the possible binding mode of metallacycle 101 and heparin; (b) emission spectral changes of metallacycle 101 with the addition of heparin; (c) AFM images of a mixture of metallacycle 101 and heparin[244] |

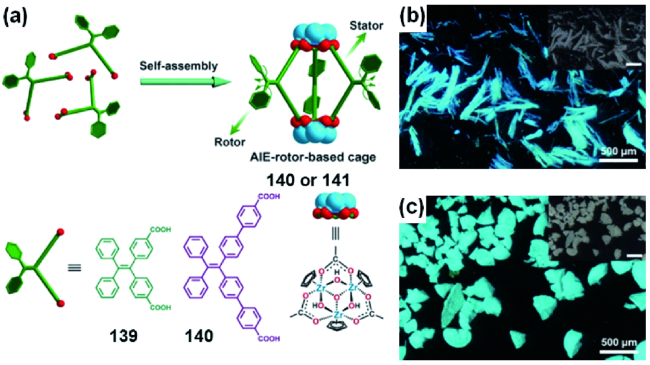
2.4.3.2 具有AIE性质的金属有机笼
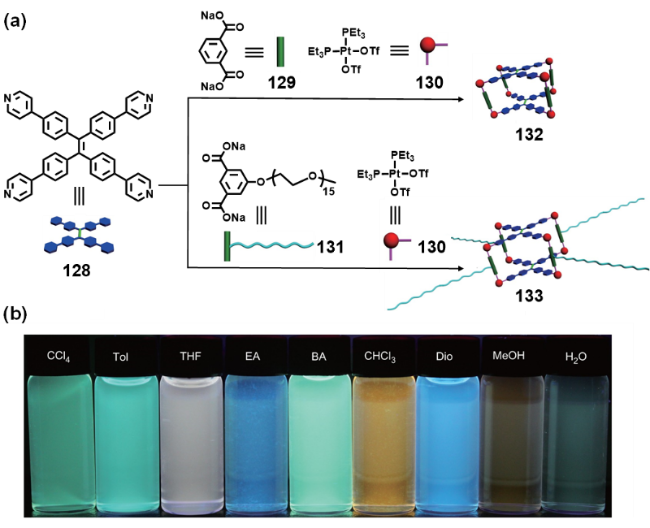
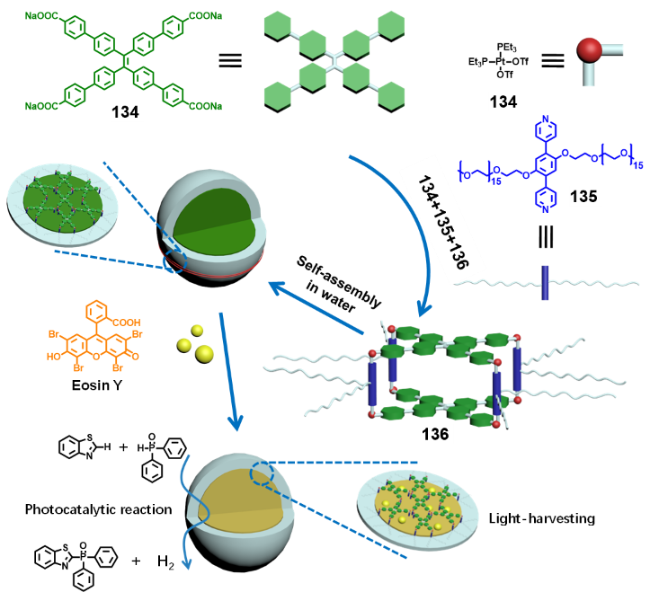
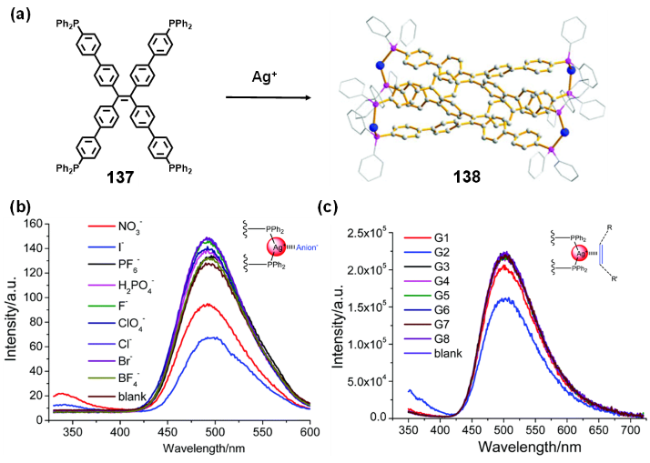
图57 (a) 金属有机笼138的自组装示意图;(b) 金属有机笼138中加入不同阴离子的荧光发射光谱;(c) 金属有机笼138中加入不同芳香化合物的荧光发射光谱[252]Fig. 57 (a) Self-assembly of metallacage 138;(b) emission spectral changes of metallacage 138 with the addition of different anions;(c) emission spectral changes of metallacage 138 with the addition of different aromatic compounds[252] |

2.4.3.3 具有AIE性质的金属有机框架
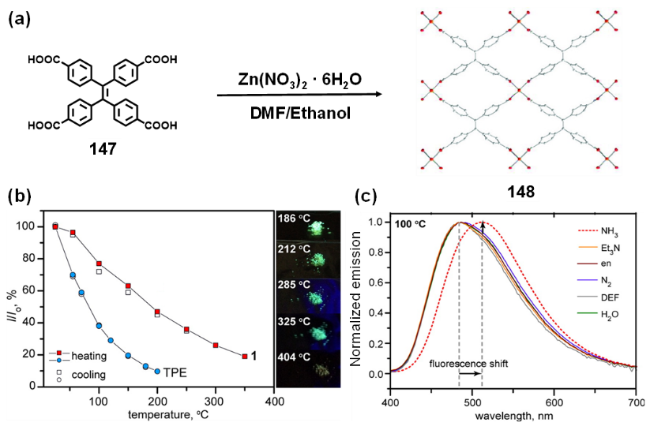
图60 (a) MOF 148 的自组装示意图[255];(b) MOF 148(正方形)和配体147(TPE,圆形)的温度依赖性荧光衰减曲线。加热和冷却循环分别用实心和空心符号表示;(c) MOF 148 在 100 ℃下暴露于各种分析物的归一化发射光谱[256]Fig. 60 (a) Self-assembly of MOF 148[255]; (b) Temperature-dependent fluorescence decay profiles of MOF 148 (squares) and ligand 147 (TPE, circles). Heating and cooling cycles are represented as filled and open symbols, respectively; (c) Normalized emission spectra of MOF 148 exposed to various analytes at 100 ℃[256] |
3 AIE机理
3.1 AIE的微观机制
3.1 J-聚集体发光机理
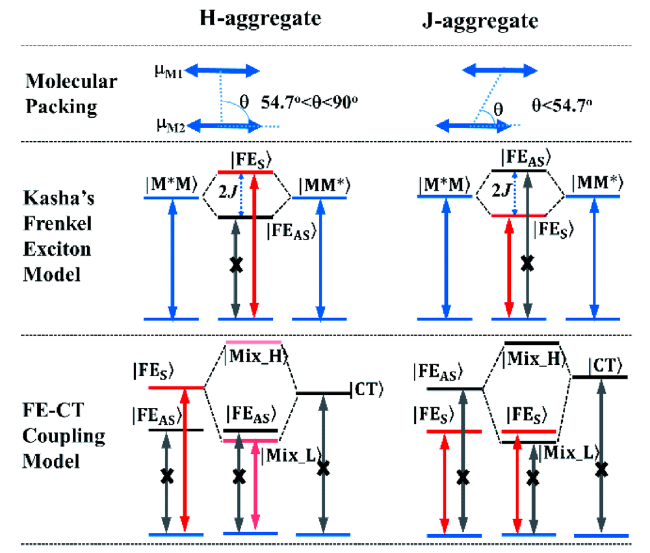
图64 H-聚集体和J-聚集体的Kasha的Frenkel激子(FE)模型和FE激子与电荷转移(CT)激子的耦合模型[273]Fig. 64 Schematic Kasha's Frenkel exciton (FE) model and FE-CT coupling model of H- and J-aggregate dimers. FES and FEAS are the dipole-allowed symmetric FE and dipole-forbidden antisymmetric FE, respectively. The FE-CT coupling model is established when the electron and hole transfer integrals te and th meet te ? th for H-aggregate and te ≈-th for J-aggregate, respectively[273] |
3.2 分子内运动受限机理
3.3 无辐射通道受阻机理
3.4 聚集诱导辐射跃迁机理
4 AIE概念的衍生
4.1 有机室温磷光
4.1.1 结晶诱导磷光和聚集诱导磷光
4.1.2 有机室温磷光体系


4.1.3 有机室温磷光三线态调控
4.1.3.1 有机室温磷光寿命调控
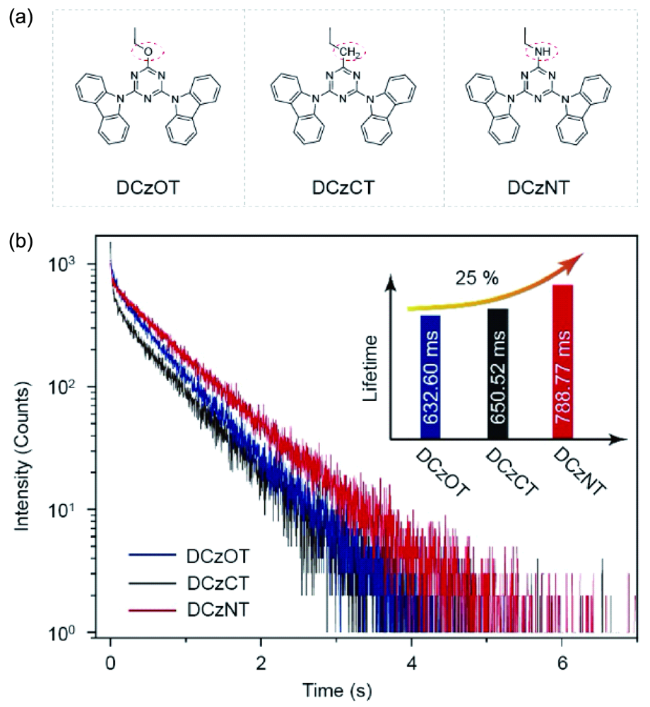
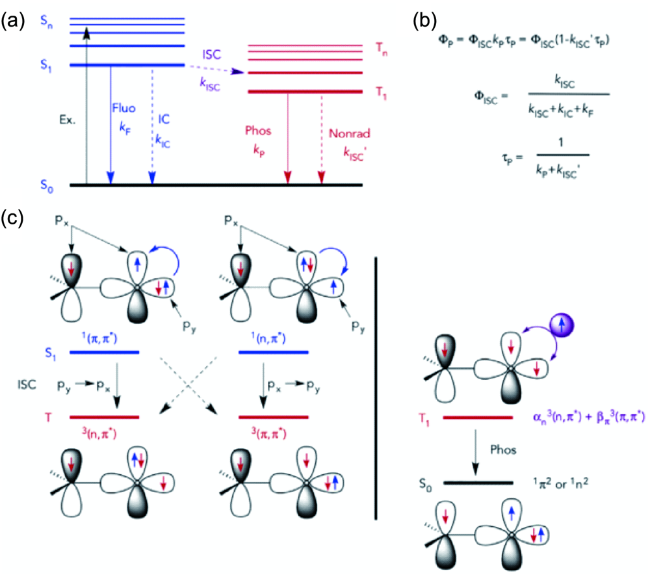
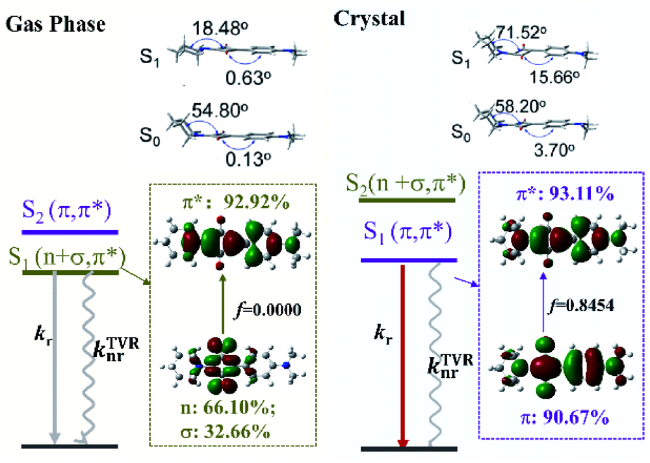
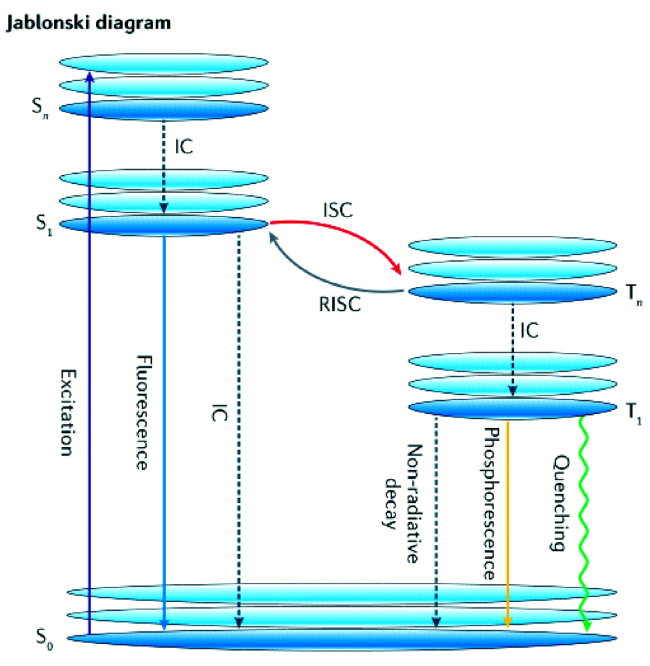
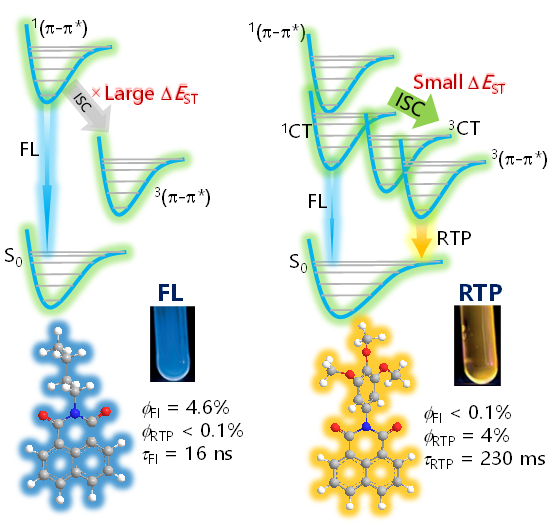
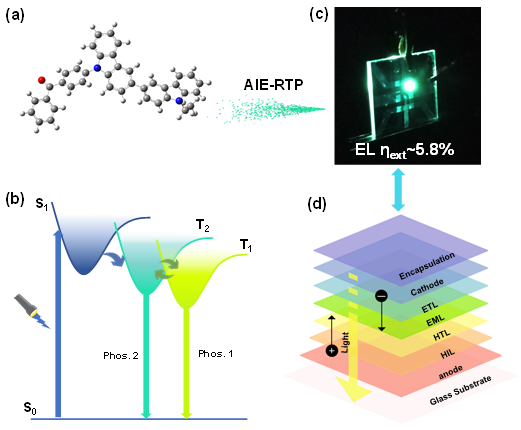
图77 纯有机RTP性能的理论模型。(a) 有机发光体的Jablonski图。(b) 磷光量子产率、ISC量子产率和磷光寿命的方程。(c) ISC和分子轨道杂交的El-Sayed规则的示意图,用于调节磷光衰减速率的最低三重态。通常,持久的有机磷光是由具有纯3(π, π*)构型的T1极慢的辐射衰减率引起的[325]Fig. 77 Theoretical models for understanding the performance of pure organic RTP.(a) A Jablonski diagram of organic luminophores. (b) Equations for phosphorescence quantum yield, ISC quantum yield, and phosphorescence lifetime. (c) Schematic representation of the El-Sayed rule for ISC and molecular-orbital hybridization of the lowest triplet states for tuning the rate of phosphorescence decay. Generally, persistent organic phosphorescence results from an extremely slow radiative decay rate of T1 with a pure3(π, π*) configuration[325] |
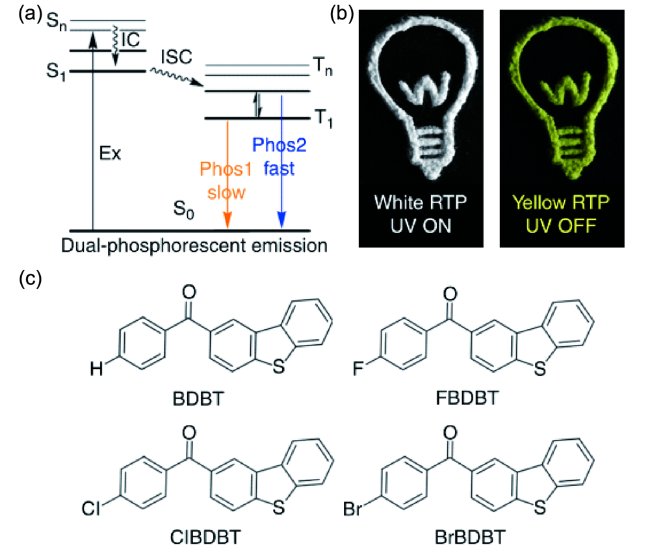
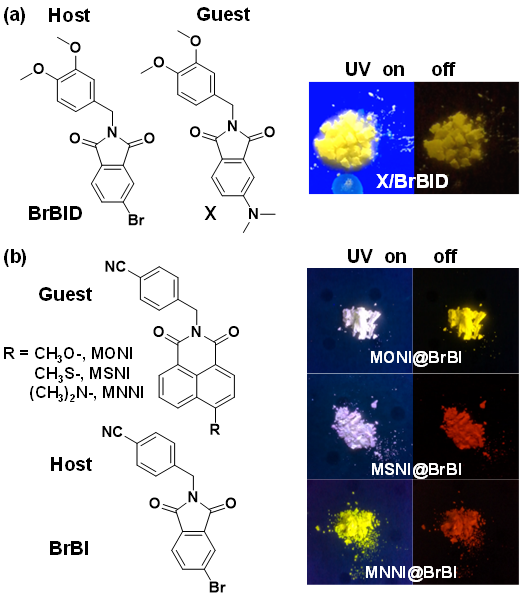
图78 开发单分子白光RTP体系的策略和实例。(a) 双磷光发射的Jablonski图。(b) ClBDBT的照片图案。使用ClBDBT粉末绘图案。白光是在激发源打开时拍照所得,黄灯是在激发源关闭时所得。(c) 室温磷光体的分子结构[326]Fig. 78 Strategy and example to develop single molecule white light-emitting RTP system. (a) Jablonski diagram for dual phosphorescent emission. (b) Photo-pattern of ClBDBT. A lamp was drawn using powder of ClBDBT. The white lamp was taken when excitation source is on, the yellow lamp was taken when excitation source is off. (c) Molecular structures of room temperature phosphors studied here[326] |
4.1.3.2 有机室温磷光的效率调控
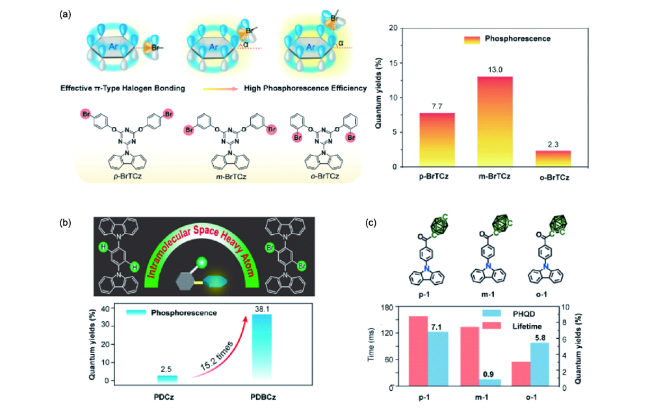
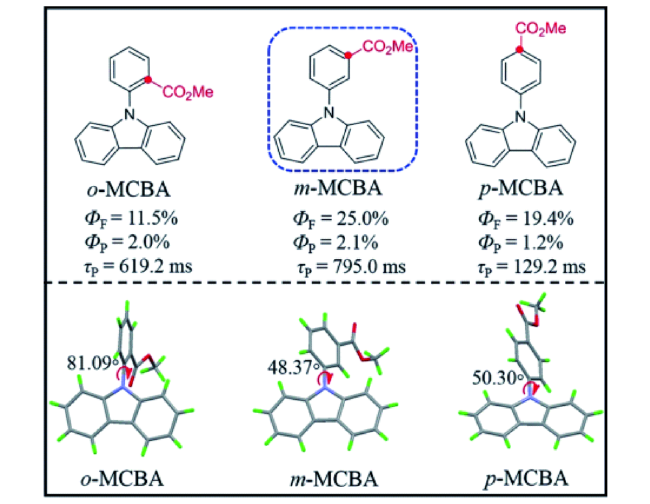
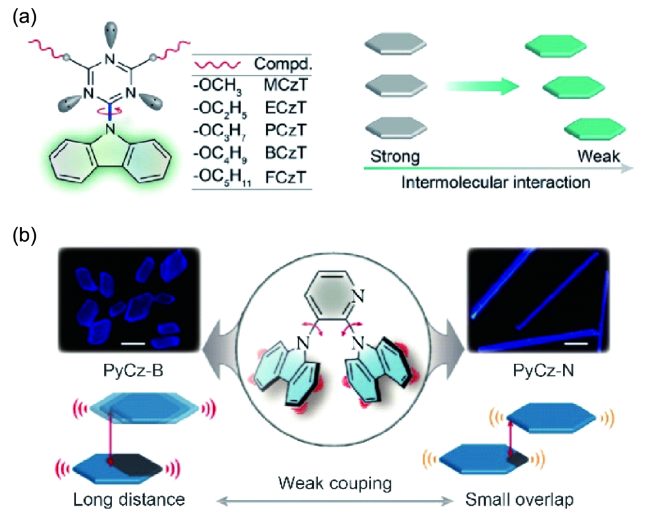
图82 (a) 化合物p-BrTCz、m-BrTCz、o-BrTCz的分子结构及磷光效率[330]。(b) 化合物PDCz和PDBCz的分子结构及磷光效率[331]。(c) 化合物p-1、m-1、o-1的分子结构及磷光效率、寿命[332]Fig. 82 (a) Molecular structures and phosphorescence quantum yields of the compounds p-BrTCz, m-BrTCz, and o-BrTCz[330]. (b) Molecular structures and phosphorescence quantum yields of the compounds PDCz and PDBCz[331]. (c) Molecular structures, phosphorescence yield, and lifetimes of the compounds p-1, m-1, and o-1[332]. |
4.1.3.3 有机室温磷光的颜色调控
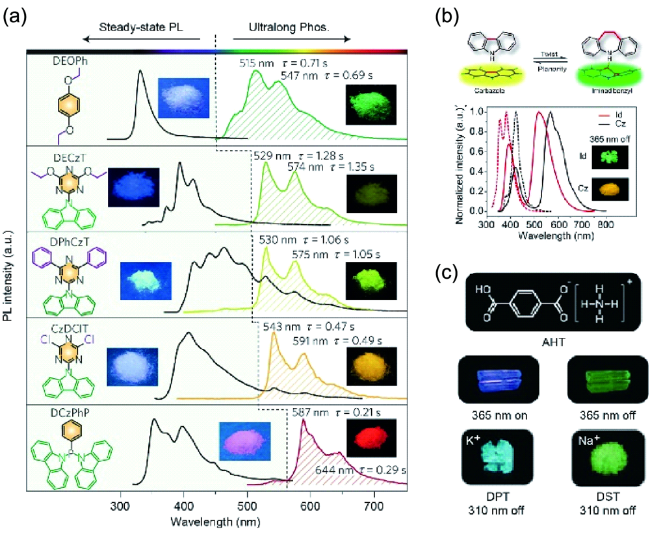
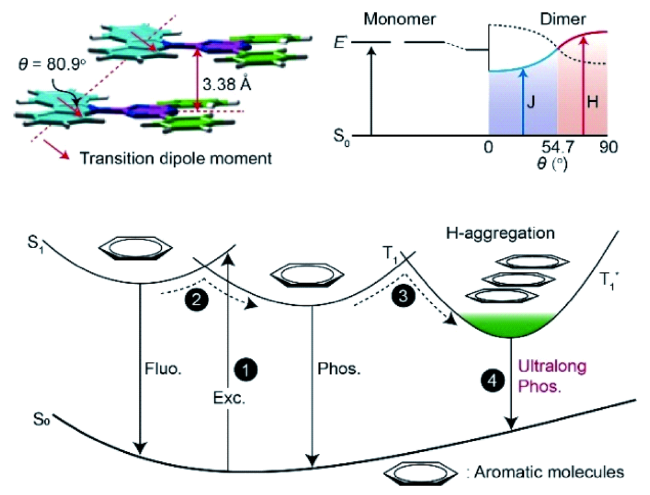
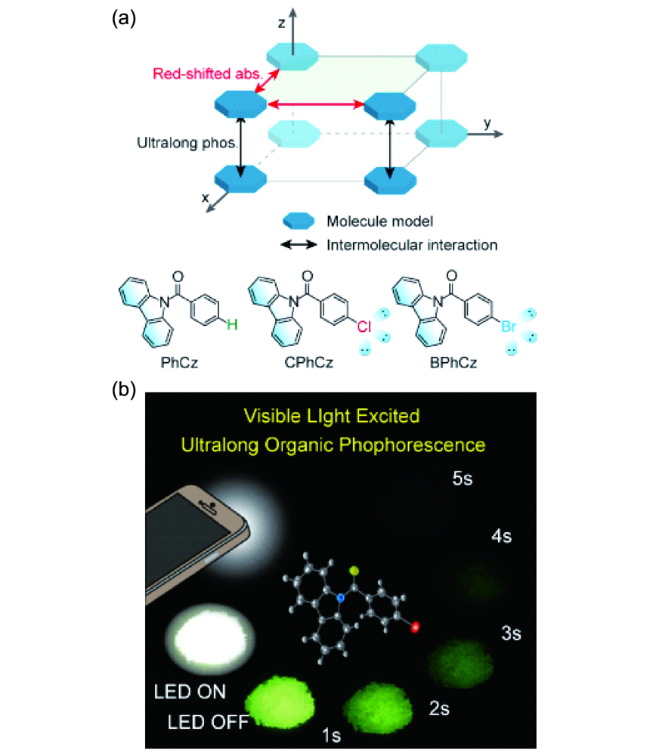
图85 多彩的超长有机磷光材料体系。(a) 基于H-型聚集体结构的多彩超长磷光分子及其光物理性质[312]。(b) 咔唑和亚氨基二苄基的分子结构及光致发光和磷光光谱[314]。(c) 离子晶体的分子结构及光致发光和长余辉图片[319]Fig. 85 Colorful ultralong organic phosphorescent material system. (a) Colorful ultralong phosphorescent molecules based on H-type aggregate structure and their photophysical properties[312]. (b) The molecular structures and photoluminescence and phosphorescence spectra of carbazole and iminodibenzyl[314]. (c) The molecular structures and photoluminescence and long afterglow pictures of ionic crystals[319] |
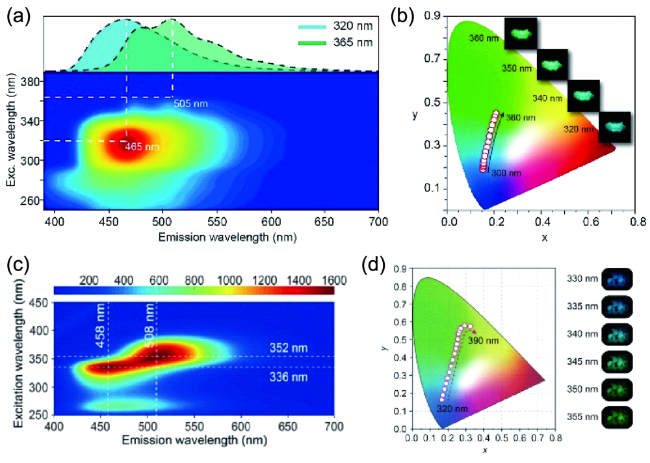
图86 基于不同发光中心的单组分多彩超长有机磷光。(a) 2,4,6-三甲氧基-1,3,5-三嗪(TMOT)粉末的激发发射磷光光谱。插图:TMOT粉末在不同激发下的磷光光谱。(b) 激发波长改变导致的磷光CIE坐标变化[338]。插图:TMOT在不同激发下的余辉照片。(c) 海因分子的磷光激发发射光谱。(d) 海因在不同激发下的磷光CIE坐标变化及相关照片[339]Fig. 86 Single component colorful RTP materials. (a) Excitation-phosphorescence mapping of 2,4,6-trimethoxy-1,3,5-triazine (TMOT) under ambient conditions. Inset shows the phosphorescence spectra of TMOT following different excitations. (b) The recorded CIE coordinate by varying the excitation. The inset photographs show the relative afterglow photographs of the TMOT powder[338]. (c) Excitation-phosphorescence mapping of glycolylurea. (d) The change of CIE coordinate with the variation of excitation wavelength[339] |
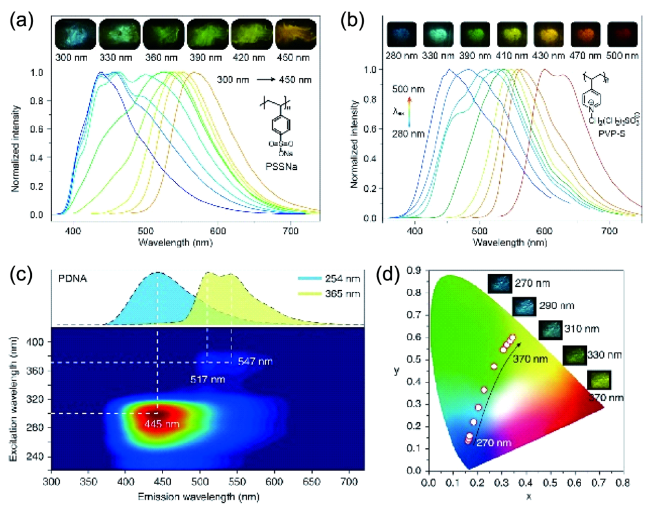
图87 (a) PSSNa[320]和(b) PVP-S[321]在77 K下不同波长激发下的磷光光谱和照片。(c) PDNA薄膜的磷光发射与激发映射图。(d) PDNA薄膜在不同激发波长下的磷光颜色变化[322]Fig. 87 Excitation dependent phosphorescence spectra and photographs of (a) PSSNa[320] and (b) PVP-S[321] at 77 K. (c) Excitation-phosphorescence mapping of PDNA film. (d) CIE chromaticity diagram and phosphorescence photographs of PDNA with varied excitation[322] |
4.1.3.4 有机室温磷光的激发波长调控
4.1.3.5 有机室温磷光性质的动态调控
4.1.3.6 主客体掺杂调控有机室温磷光
4.1.4 有机室温磷光材料的应用
4.1.4.1 OLED
4.1.4.2 生物成像与治疗
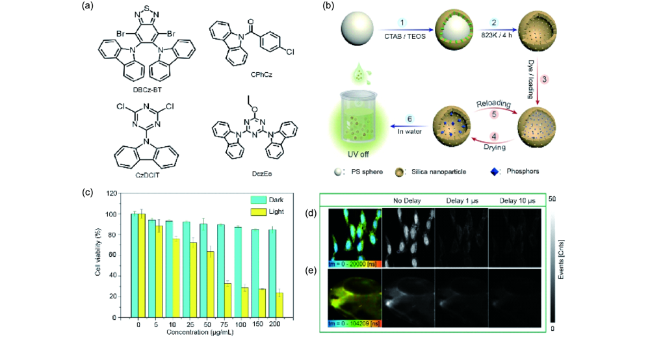
图93 (a) RTP分子的化学结构[350]。(b) 负载磷光体的中空介孔二氧化硅纳米粒子的制备示意图。(c) 在不同条件下,HeLa细胞存活率关系图。(d, e) 活HeLa细胞和斑马鱼的磷光成像[351]Fig. 93 (a) Chemical structures of the RTP molecules[350]. (b) Schematic illustration of the fabrication of HMSNPs loaded with phosphors. (c) Viability values of HeLa cells incubated with PNDs in dark or under excitation. (d, e) Images of living HeLa cells and zebrafish[350] |
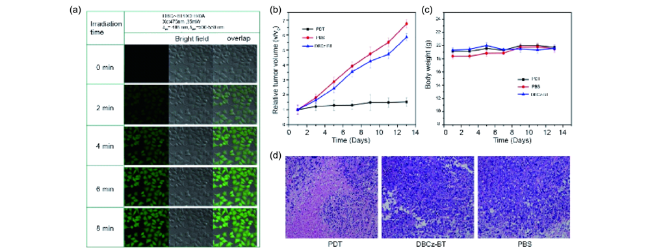
图94 (a) 不同照射时间下,在500~550 nm处采集的HeLa细胞的明场和重叠的共聚焦图像。(b) 不同组的小鼠在治疗时间延长下的肿瘤相对体积变化和(c)体重变化。(d) H&E染色对照组和治疗组的肿瘤组织切片的图像[352]Fig. 94 (a) Confocal images of HeLa cells collected at 500~550 nm, bright field and overlap under different irradiation time. (b) Relative tumor volume and (c) body weight of mice in different groups with prolonged treatment time. (d) H&E stained images of tumor slices from the tumor tissues of the control and treated groups[352] |
4.1.4.3 挥发性有机物传感

4.1.4.4 信息加密
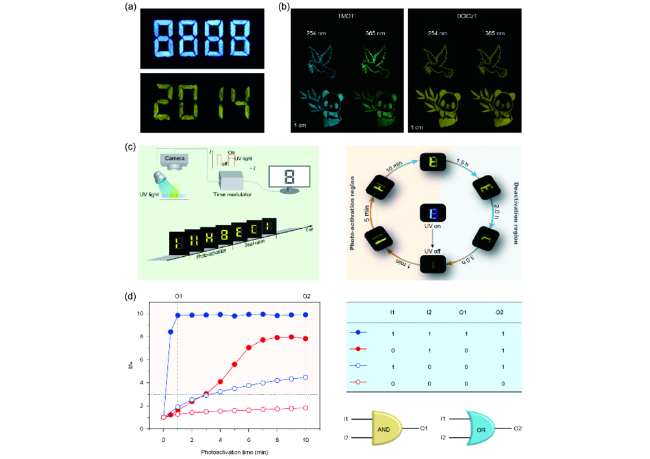
图96 有机磷光在信息加密的应用。(a) 在紫外灯照射前后的图案[314]。(b) 在不同激发下的多色磷光图案[338]。(c) 多级防伪展示[342]。(d) 分子逻辑门中的应用演示[343]Fig. 96 The application of information encryption. (a) The imaging patterns before (top) and after (bottom) excitation[314]. (b) The multi-color phosphorescent patterns under different excitation[338]. (c) Multi-level anti-counterfeiting experiment[342]. (d) Application in molecular logic gates[343] |
4.2 非典型发光
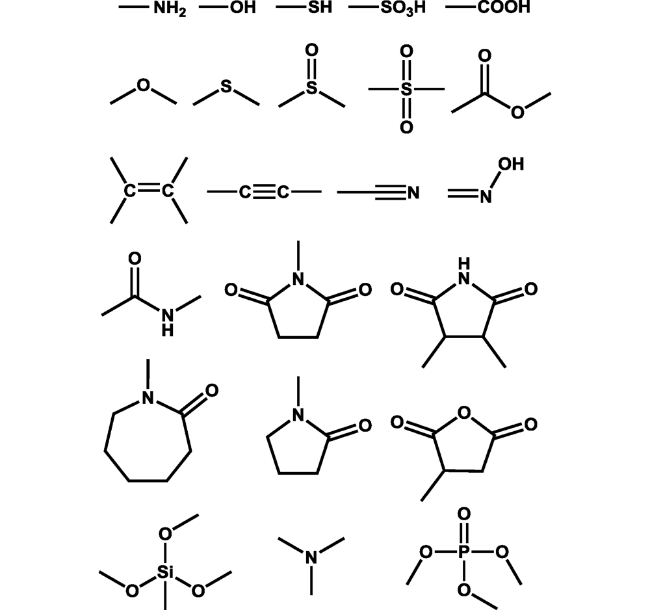
图97 非典型发光化合物中常见的亚荧光团Fig. 97 Common subfluorophores in nonconventional luminophores |

图98 (a) D-木糖[359]、N,N'-羰基双丁二酰亚胺(CBSI)在不同紫外灯照射下及关灯后的照片[360]。(b) L-赖氨酸(L-Lys)及ε-聚(L-赖氨酸)(ε-PLL)在365 nm紫外灯照射下或关灯后的照片[361]Fig. 98 (a) Photographs taken under and after the stop of varying UV lights for D-xylose[359] and CBSI[360]. (b) Photographs taken under and after the stop of 365 nm UV light for L-lysine and ε-PLL[361] |
4.2.1 非典型发光化合物的分类
4.2.1.1 非典型发光聚合物
4.2.1.2 非典型发光小分子
4.2.2 非典型发光化合物的发光机理
4.2.3 非典型发光化合物的光物理性质
4.2.4 非典型发光化合物的光物理性质的调节
4.2.4.1 发光波长调节
4.2.4.2 发光强度或量子效率调节
5 材料的刺激响应特性
5.1 力致发光变色
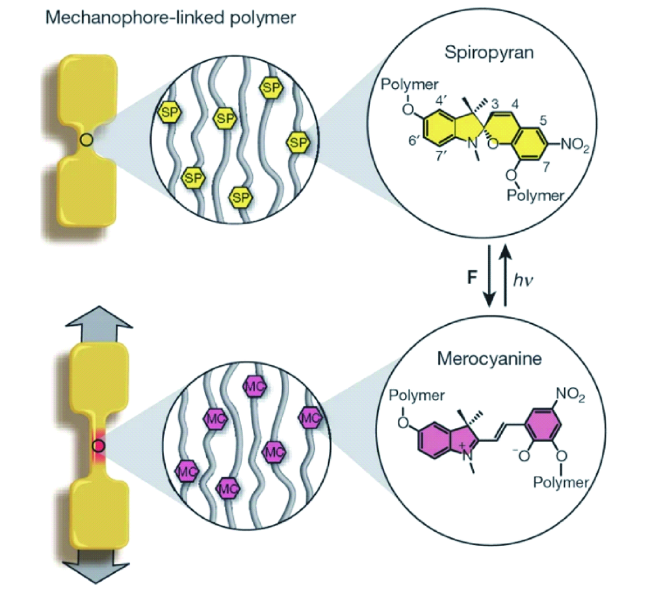
图101 哑铃型样条由分子量8万的线型聚丙烯酸甲酯制成,在拉伸应力下,无色螺吡喃结构可能转变成红色的部花青结构,暴露在可见光下可以恢复为原来的螺吡喃结构[385]Fig. 101 Schematic diagram of ‘dog bone' specimens prepared from linear 80 kDa PMA. Upon application of tensile force, a hypothesized conversion between the colourless spiropyran and coloured merocyanine forms of the mechanophore occurs. Exposure to visible light reverses the conversion back to the original spiropyran form[385] |
5.1.1 小分子力致发光变色材料
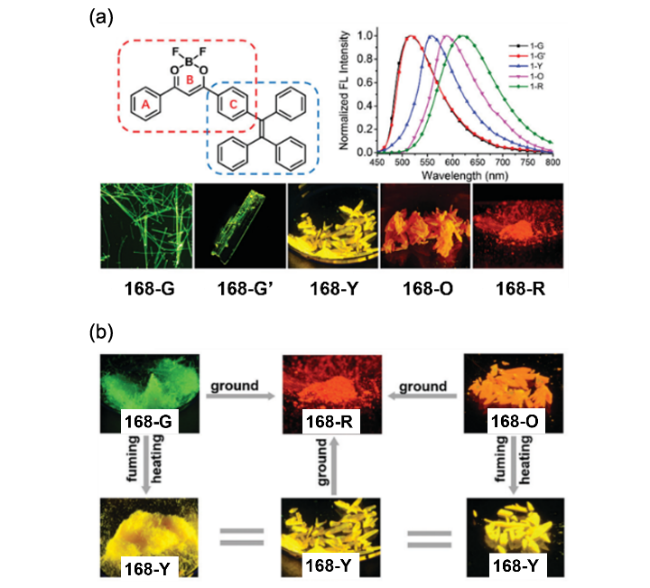
图104 (a) 化合物168的分子结构及在不同聚集状态下的发光照片;(b) 外界刺激下不同聚集状态之间相互转化前后的发光照片[403]Fig. 104 (a) Chemical structure of compound 168; normalized emission spectra of 168-G, 168-G0, 168-Y, 168-O and 168-R. lex=420 nm. The fluorescent images of compound 168 in its four polymorphs and one amorphous solid state (microscopy images of 168-G and 168-G0; the photographs of 168-Y, 168-O and 168-R taken under 365 nm UV lamp. (b) Transition among five different aggregates with diverse luminescent colors upon stimuli: 168-G and 168-O crystalline powders can transform into 168-Y crystalline powders by heating or fuming with DCM vapor; all crystalline powders can transform into 168-R aggregates by fully grinding[403] |
5.1.2 聚合物力致发光变色材料
5.2 力致发光
5.2.1 力致荧光
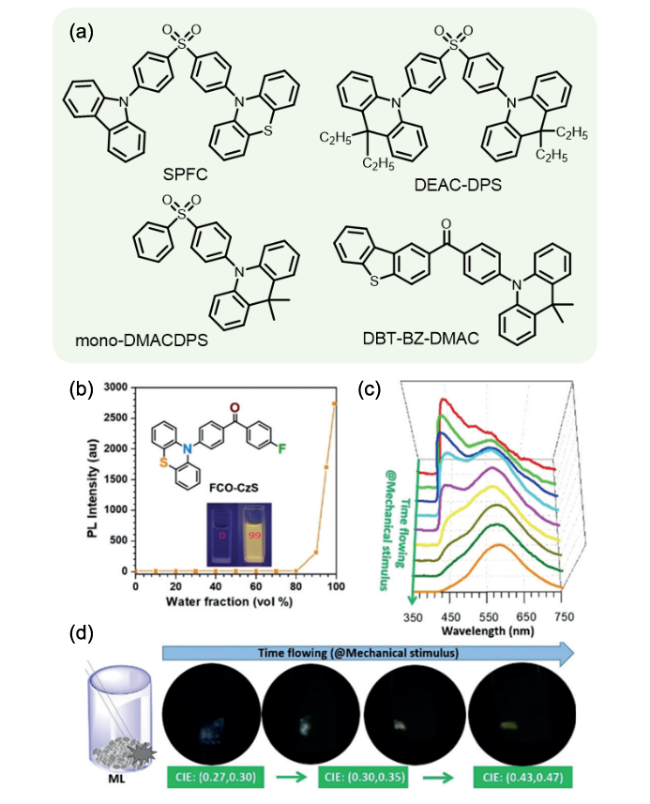
图106 (a) SPFC、DEAC-DPS、mono-DMACDPS与DBT-BZ-DMAC的分子结构。(b) FCO-CzS的分子结构与在Water/THF溶剂中的发光强度。FCO-CzS随着研磨时间增长的ML光谱(c)与ML照片(d)[409]Fig. 106 (a) Molecular structures of SPFC, DEAC-DPS, mono-DMACDPS and DBT-BZ-DMAC. (b) The emission intensity of FCO-CzS in mixture solution of Water/THF; (c) ML spectra and (d) ML photos of FCO-CzS as the increase in grinding time[409] |
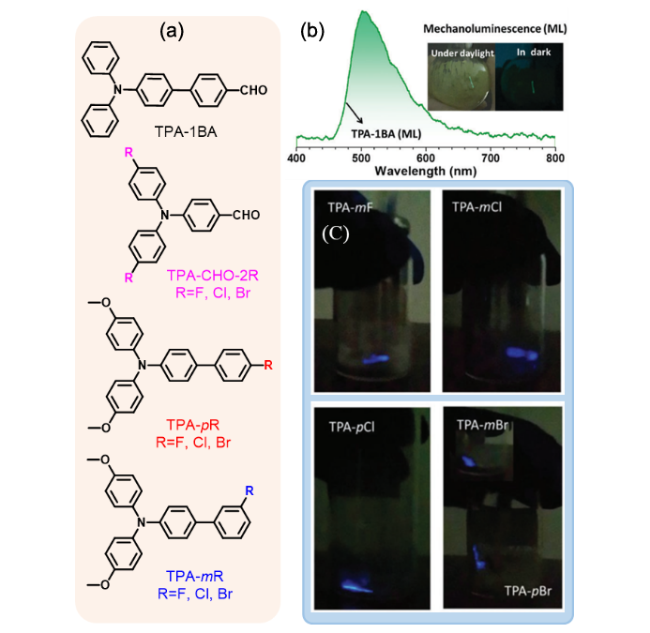
图108 (a) 化合物TPA-1BA、TPA-pR、TPA-mR、TPA-CHO-2R(R=F, Cl, Br)的分子结构。(b) TPA-1BA的ML光谱与日光、黑暗环境下的ML照片[411]。(c) TPA-mF、TPA-mCl、TPA-pCl、TPA-mBr和TPA-pBr的ML照片[413]Fig. 108 (a) Molecular structures of TPA-1BA,TPA-pR,TPA-mR,TPA-CHO-2R (R=F, Cl, Br). (b) ML spectrum and photos of TPA-1BA under daylight and dark[411]. (c) ML photos of TPA-mF, TPA-mCl, TPA-pCl, TPA-mBr and TPA-pBr[413] |
5.2.2 同质多晶
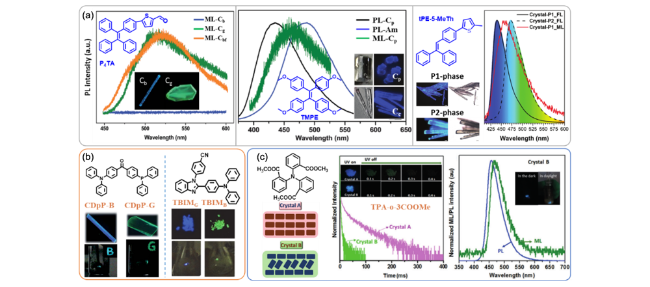
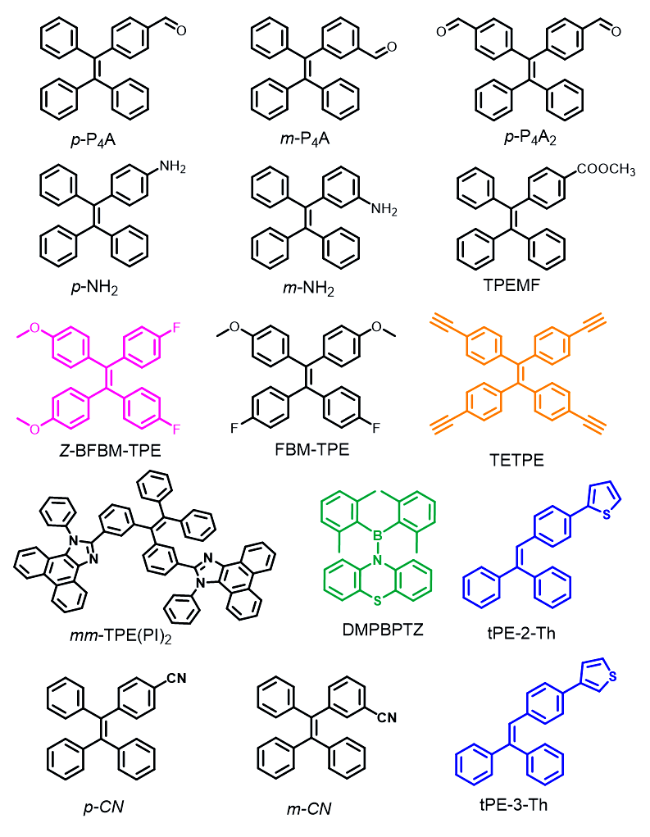
图110 (a) P4TA[422]、TMPE[423]、tPE5-MeTh[424]的分子结构与同质多晶的晶相照片与ML光谱;ML-Cbf为Cb相经二氯甲烷熏蒸后ML光谱。(b) CDpP[425]与TBIM[426]分子结构与不同晶相与ML照片。(c) TPA-o-3COOMe分子结构与不同晶相分子排列方式与磷光寿命曲线、晶相B的ML照片与光谱[427]Fig. 110 (a) Molecular structures of P4TA[422], TMPE[423], tPE5-MeTh[424] and corresponding polymorphism photos, ML spectra; ML-Cbf refers to Cb phase crystal after fuming by dichloromethane. (b) Molecular structures, polymorphism and ML photos of CDpP[425] and TBIM[426]. (c) Molecular structure, molecular arrangement in polymorphism, time-resolved RTP spectra, ML spectrum and photos of TPA-o-3COOMe[427] |
5.2.3 力致磷光
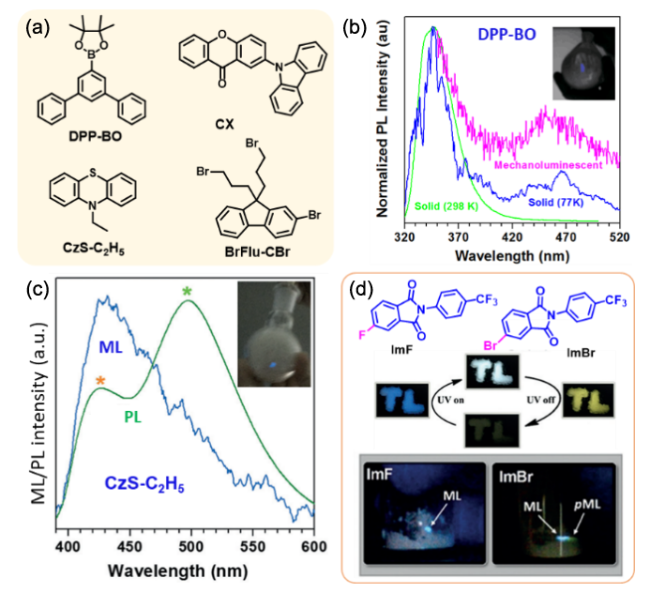
图111 (a) 化合物DPP-BO、CX、CzS-C2H5与Br-Flu-CBr分子结构。(b) DPP-BO和(c) CzS-C2H5的PL与ML光谱与ML照片[429]。(d) 化合物ImF与ImBr的分子结构、ML照片与ImBr在紫外灯下的RTP现象[431]Fig. 111 (a) Molecular structures of DPP-BO, CX, CzS-C2H5 and Br-Flu-CBr. ML and PL spectra and ML photos of DPP-BO (b) and CzS-C2 (c). (d) Molecular structure, RTP and ML photos of ImF and ImBr[431] |
5.2.4 掺杂型ML

图112 (a) 化合物Cz-alkyl-6[432]与NPC[433]的分子结构,掺杂荧光客体分子后的ML光谱。(b) 主体PCP、PA与DCB,客体NA的分子结构[37],受到力刺激后的即时与延迟ML照片[347]Fig. 112 (a) Molecular structure of Cz-alkyl-6[432], NPC[433], and ML spectra of them when doped with fluorescent dopant. (b) Molecular structures of host of PCP, PA, and DCB, guest of NA, ML photos of flash ML and delayed ML[347] |
5.2.5 力致发光HOF材料


5.3 一些其他的刺激响应特性
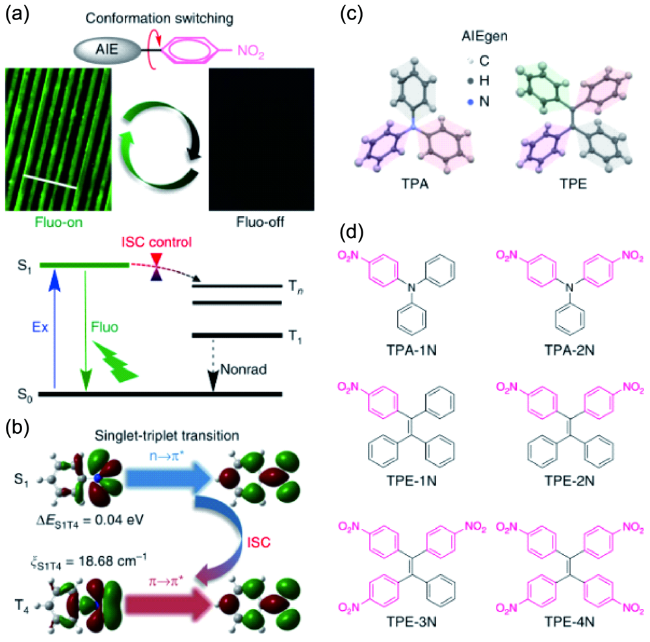
图118 通过控制系统间交叉来制定MRL材料的策略。(a) 通过控制硝基苯基化AIEgens的系统间交叉来提出高灵敏度On-Off MRL材料的机制。标尺:100 μm。(b) 硝基苯的最低单重激发态(S1)和三重激发态(T4)的自然跃迁轨道。由于El-Sayed规则表明,当自旋轨道耦合混合自旋和电子配置不同的两种状态时,多重性变化变得非常有效,因此T4是系统间交叉过程中的密室和良好的“接收器状态”,它决定了超快通过有利的1(n,π*)到3(π,π*)通道消耗S1。(c) 典型AIEgens的扭曲晶体结构:三苯胺(TPA)和四苯乙烯(TPE)。(d) 这里研究的硝基TPA和硝基TPE的分子结构[437]Fig. 118 Strategies for MRL materials by controlling intersystem crossing. (a) Proposed mechanism of highly sensitive On-Off MRL materials by controlling intersystem crossing of nitrophenylated AIEgens. Scale: 100 μm. (b) Nature transition orbitals of the lowest singlet excited state (S1) and triplet excited state (T4) of nitrobenzene. Since El-Sayed's rule states that the multiplicity change becomes highly efficient when the spin-orbit coupling mixes two states differing in both spin and electronic configuration, T4 is the closet and a good “receiver state” in the intersystem crossing process which determines the ultrafast S1 depletion through an favored1(n,π*) to3(π,π*) channel. (c) Twisted crystal structures of typical AIEgens: triphenylamine (TPA) and tetraphenyethylene (TPE). (d) Molecular structures of nitro-TPAs and nitro-TPEs studied here[437] |

图119 (a) TPE-4N的光敏和热敏机制示意图。(b) 在紫外线照射5 min之前(左)和之后(右)的单晶显微照片。照片是在明场(顶部)和330~385 nm的紫外线通道(底部)下拍摄的。紫外线照射的功率密度为80 mW·cm-2。(c) 在不同刺激下切换TPE-4N粉末的发光:(Ⅰ) 150 ℃加热 5 min;(Ⅱ) 紫外线照射5 min;(Ⅲ) 丙酮熏蒸30 s;(Ⅳ) 研磨;荧光照片由手持相机在365 nm紫外灯下拍摄。(d) TPE-4N粉末在不同刺激下的PL光谱。紫外线照射的功率密度为 50 mW·cm-2[443]Fig. 119 (a) Illustration of the photo- and thermoresponsive mechanism of TPE-4N. (b) Microscopy photos of single crystal before (left) and after (right) UV irradiation for 5 min. The photos are taken under bright field (top) and UV channel of 330~385 nm (bottom). The power density of UV irradiation is 80 mW·cm-2. (c) Switching the luminescence of TPE-4N powders under different stimulus: (Ⅰ) heating at 150 ℃ for 5 min; (Ⅱ) UV irradiation for 5 min; (Ⅲ) fuming with acetone for 30 s; (Ⅳ) grinding; The fluorescence photos were taken by a handheld camera under 365 nm UV lamp. (d) PL spectra of TPE-4N powders under different stimulus. The power density of UV irradiation is 50 mW·cm-2[443] |
6 AIE材料的应用
6.1 AIE在复合材料无机相分散度评价中的应用
6.1.1 无机相分散度三维荧光成像及定性评价
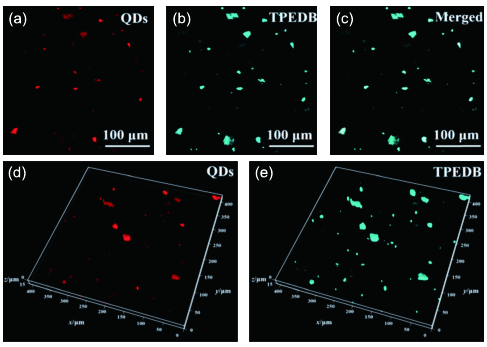
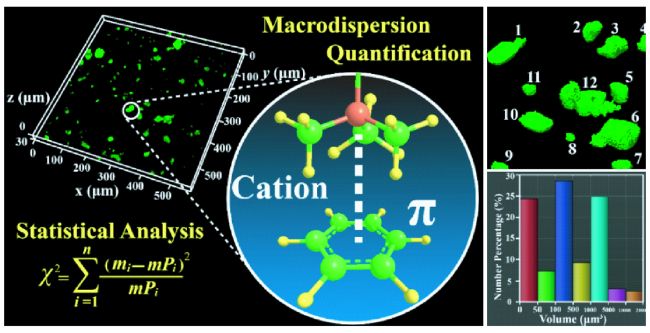
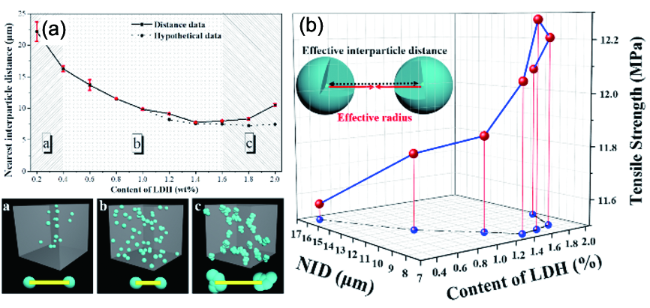
6.1.2 无机相分散度三维荧光成像及定量评价
6.2 AIE材料用于有机电致发光二极管
6.2.1 基于AIE材料的OLEDs
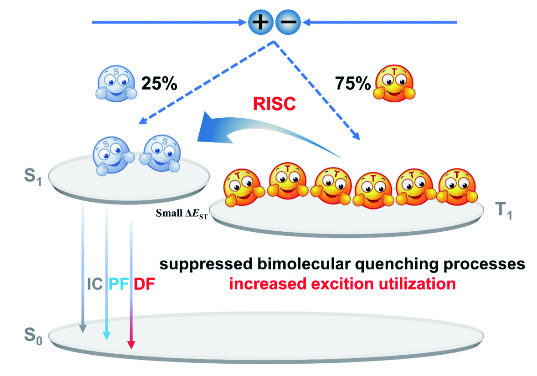
6.2.2 高激子利用率的AIE-OLEDs
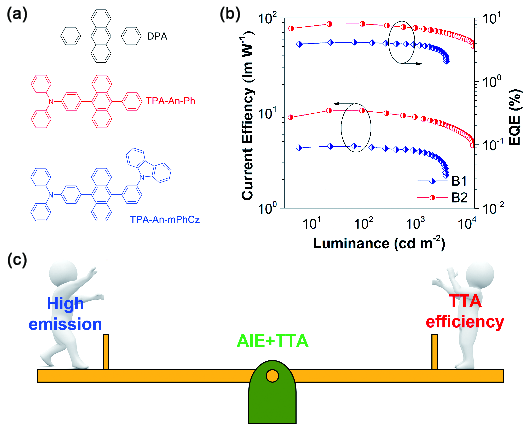
图128 (a) 蒽衍生物的化学结构;(b) TPA-An-Ph和TPA-An-mPhCz基非掺杂器件在不同亮度下的电流效率和外量子效率;(c) 蓝光发光材料的设计原理[481]Fig. 128 (a) Chemical structures of the anthracene derivatives; (b) CE and EQE versus luminance curves of the non-doped OLEDs based on the AIEgens TPA-An-Ph and TPA-An-mPhCz; (c) Design principle of the blue emitters[481] |
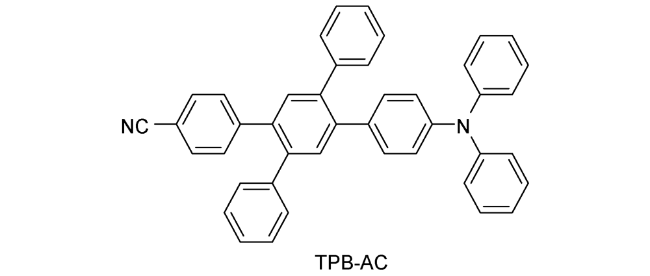
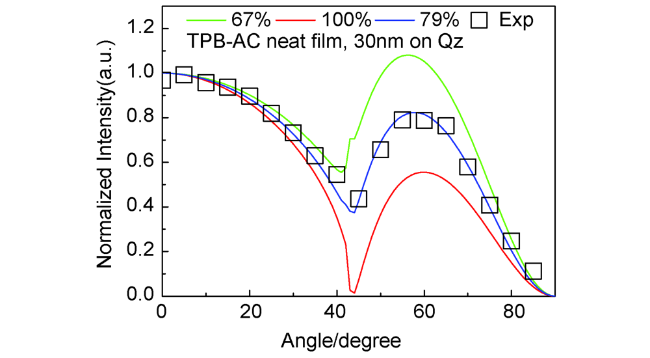
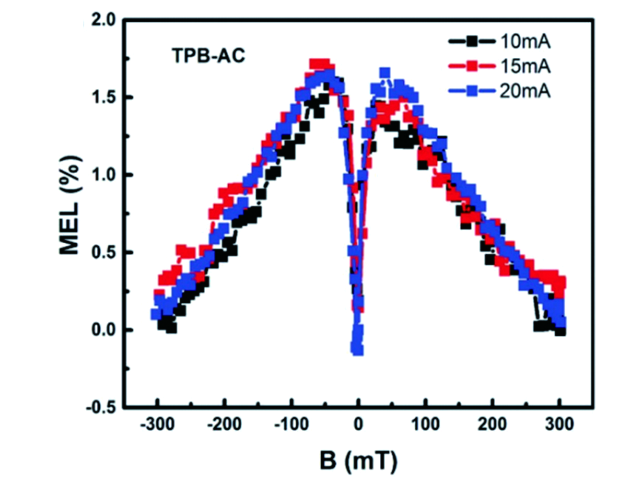
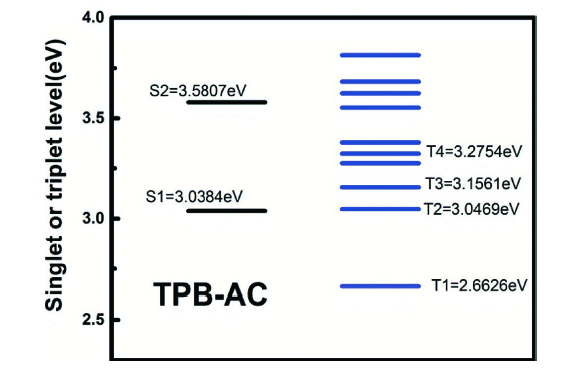
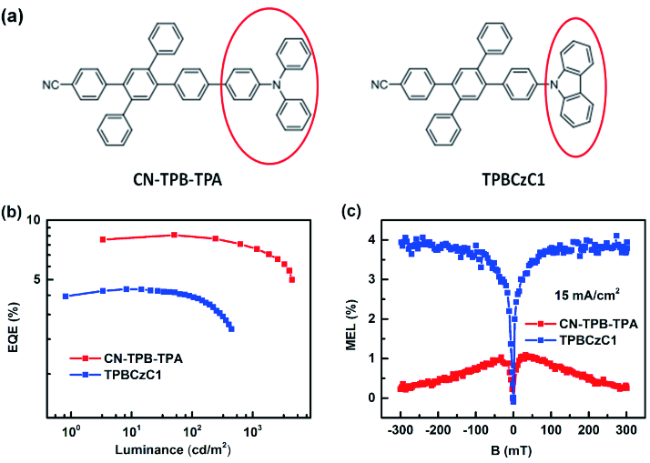
图133 (a) CN-TPB-TPA和TPBzC1的分子结构;(b) CN-TPB-TPA和TPBzC1蓝光OLEDs的EQE-亮度特性;(c) CN-TPB-TPA和TPBzC1蓝光OLEDs在15 mA/cm2电流密度下的MEL响应特性[484]Fig. 133 (a) Chemical structures of CN-TPB-TPA and TPBCzC1; (b) EQE versus luminance characteristics for CN-TPB-TPA- and TPBCzC1-based blue OLEDs; (c) MEL responses of CN-TPB-TPA- and TPBCzC1-based blue OLEDs measured at the current density of 15 mA/c |
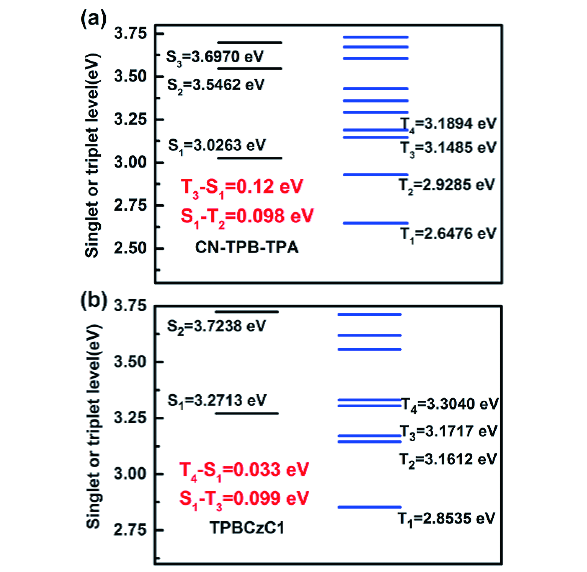

图135 (a) 基于CN-TPB-TPA设计的多层蓝光OLEDs结构与能级;(b) 发光层中的激子传递过程;(c) 单发光层和多发光层OLEDs的归一化电致发光光谱;(d) 单发光层和多发光层OLEDs的EQE-亮度特性[484]Fig. 135 (a) Energy level diagram of the designed multilayer OLEDs based on CN-TPB-TPA; (b) exciton transfer process in emission layer; (c) normalized EL spectra of the fabricated OLEDs with single- and multi-emission layers; (d) EQE versus the luminance characteristics of the fabricated OLEDs with single- and multi-emission layers[484] |

6.2.3 基于AIE材料的白光OLEDs
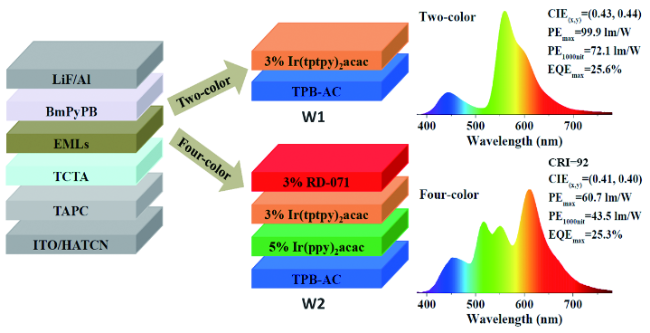
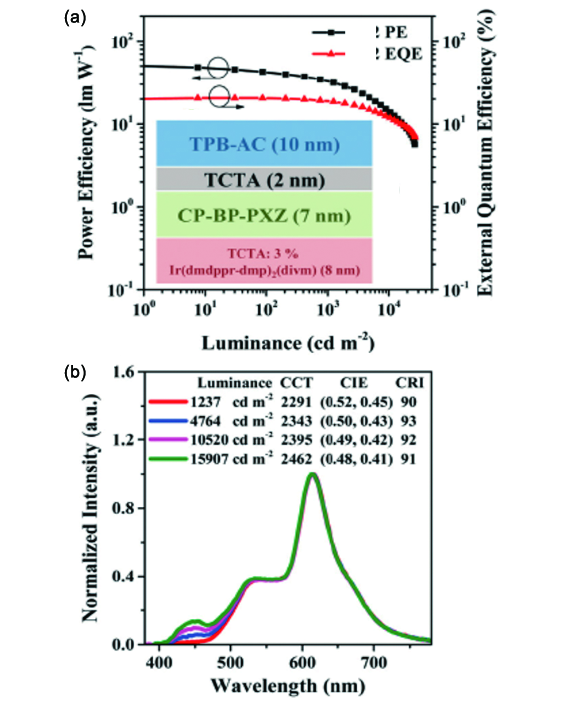
图141 用TPB-AC蓝光和CP-BP-PXZ绿光AIE材料制备的三色荧光/磷光混合型白光OLEDs的PE-EQE-亮度特性(a)和在不同亮度下的归一化电致发光光谱(b)。插图给出了发光层结构[513]Fig. 141 (a) PE-EQE-luminance characteristics and (b) normalized EL spectra at different luminance of the resulting fluorescence/phosphorescence white OLEDs based on TPB-AC as blue emitter and CP-BP-PXZ as green emitter[513] |
6.3 AIE材料在生物领域的应用
6.3.1 AIE荧光探针的设计及其用于生物检测与成像
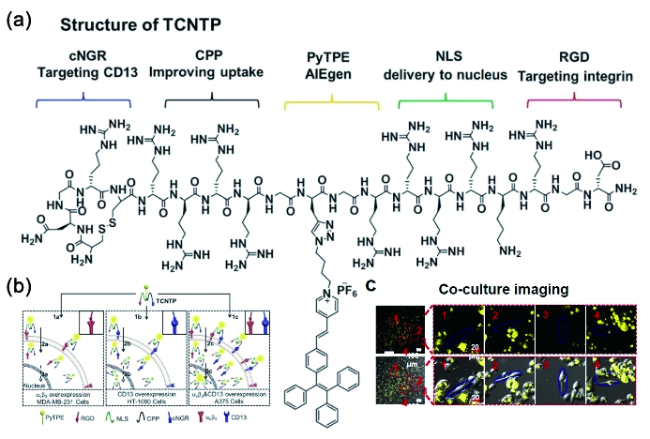
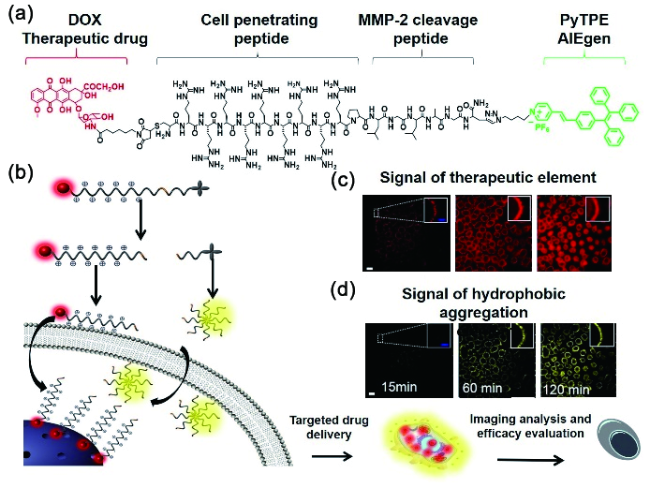
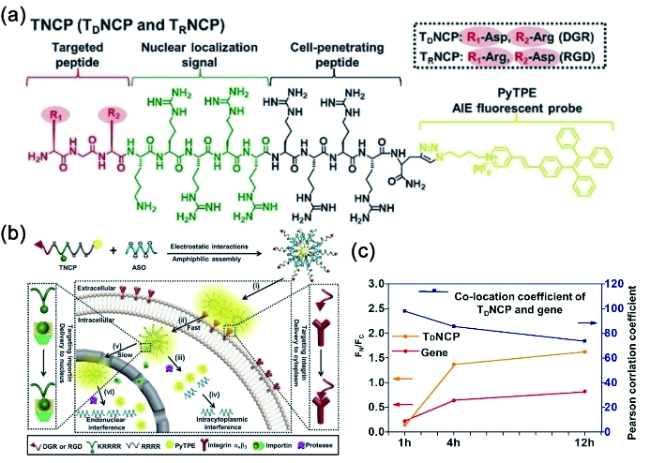
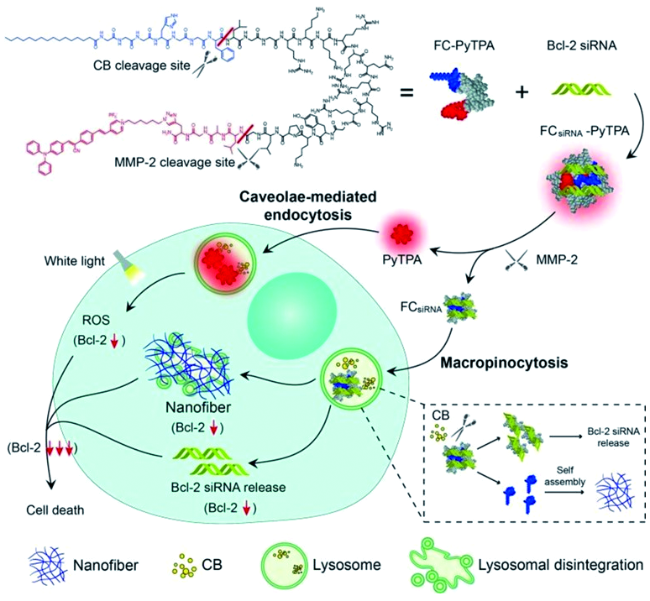
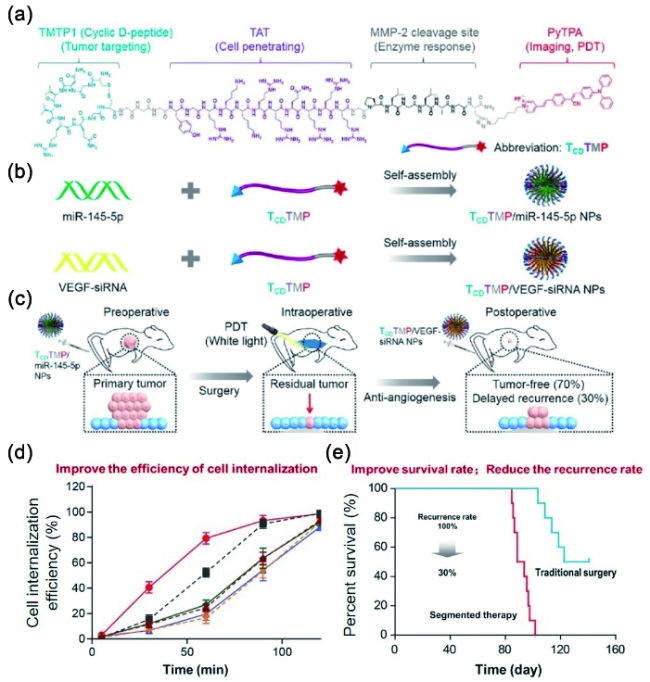
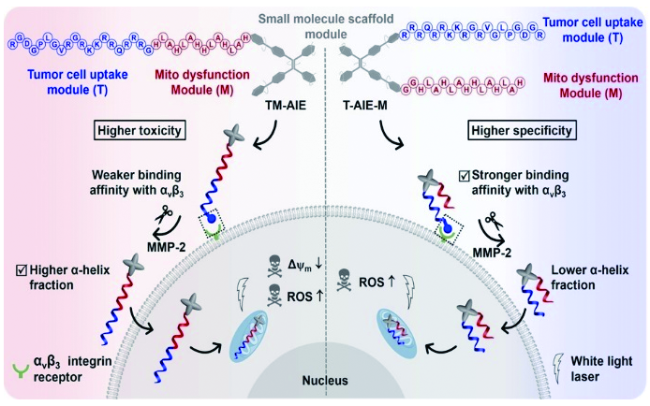
6.3.1.1 基于模块化多肽的AIE探针
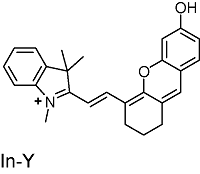
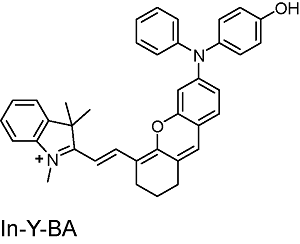
6.3.1.2 基于半菁的AIE探针对生物标志物的可激活式检测与成像
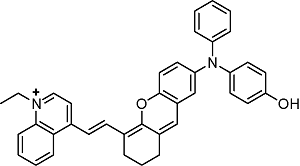
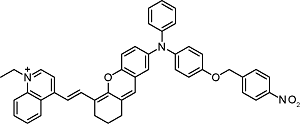
表1 半菁类生色团的结构及光学性质Table 1 Structure and photophysical properties of hemicyanine chromophores |
| Structure | Absorption (nm) | Emission (nm) |
|---|---|---|
 | 684 | 703 |
 | 710 | 730 |
 | 660 | 780,922 |
 BIN-Y | 705 | 715 |
 FB-Y-BA | 730 | 791,923 |
表2 半菁类探针响应前后的结构变化Table 2 Structural change of hemicyanine-based probes before and after response |
| Before response | After response |
|---|---|
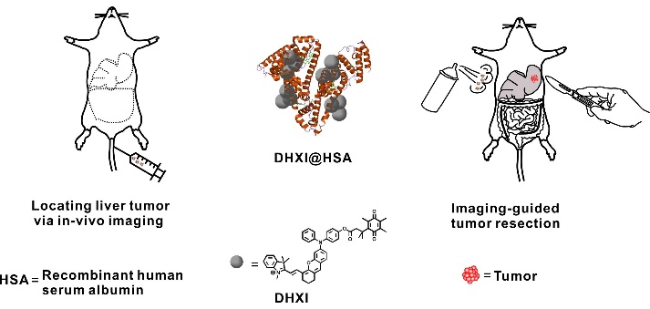
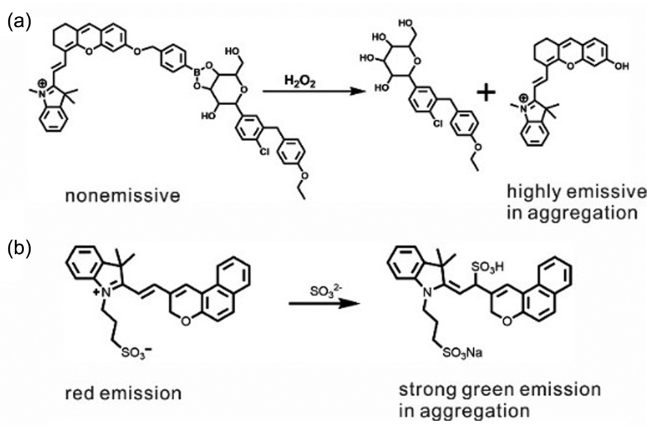
 Responsive toward nitroreductase | 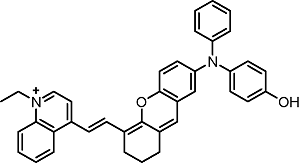 |
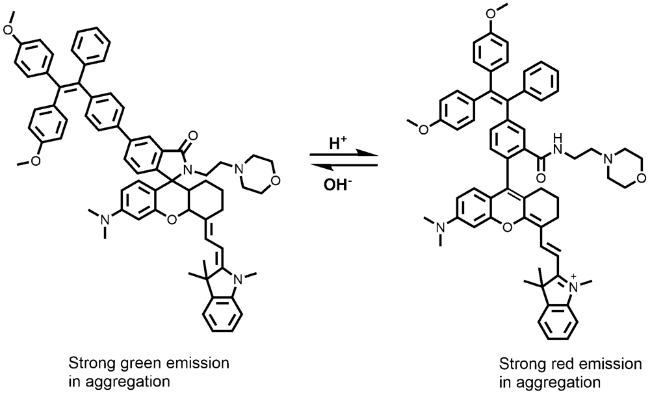
 responsive toward quinone oxidoreductase | 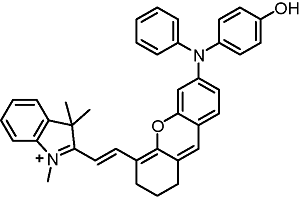 |
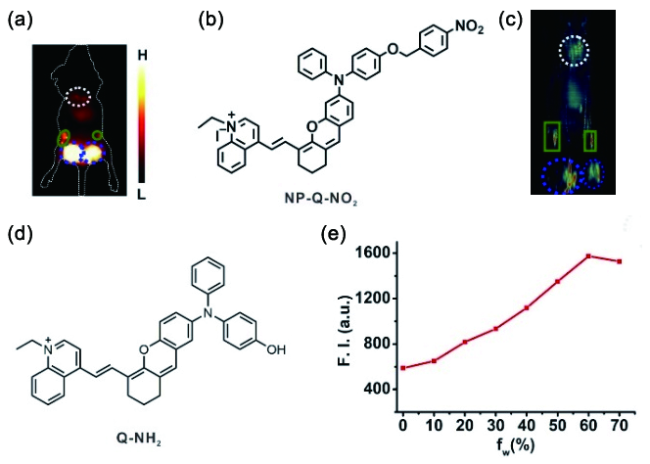
图148 (a) 探针NP-Q-NO对小鼠模型中的乳腺癌转移的NIR-Ⅱ荧光成像图;(b) 探针的结构式;(c) 探针NP-Q-NO对小鼠模型中的乳腺癌转移的多光谱光声断层扫描成像图;(d) 激活探针Q-NH2的结构式;(e) Q-NH2的AIE特性(922nm处的荧光强度与不良溶剂水含量的关系);白线:肺部,绿线:骼下淋巴结,蓝线:第五对脂肪垫原位瘤[573]Fig. 148 (a) The probe's NIR-Ⅱ fluorescent image imaging for breast cancer metastasis; (b) structure of the probe; (c) the probe's MSOT image for breast cancer metastasis; (d) structure of the activated probe; (e) AIE effect of Q-NH2 (fluorescence intensity at 922 nm versus poor solvent water fraction)[573] |
6.3.1.3 NIR二区荧光探针

图153 2TT-mC6B与2TT-oC6B的结构式与光学性质。(a) 2TT-mC6B与2TT-oC6B的结构式;(b) 2TT-mC6B与2TT-oC6B在四氢呋喃中的吸收与发射光谱;(c) αAIE随水所占比例的变化曲线[601]Fig. 153 Chemical structures and optical spectra of 2TT-mC6B and 2TT-oC6B. (a) Chemical structures of 2TT-mC6B and 2TT-oC6B; (b) Absorption and emission spectra in THF; (c) αAIE curves with water fraction[601] |
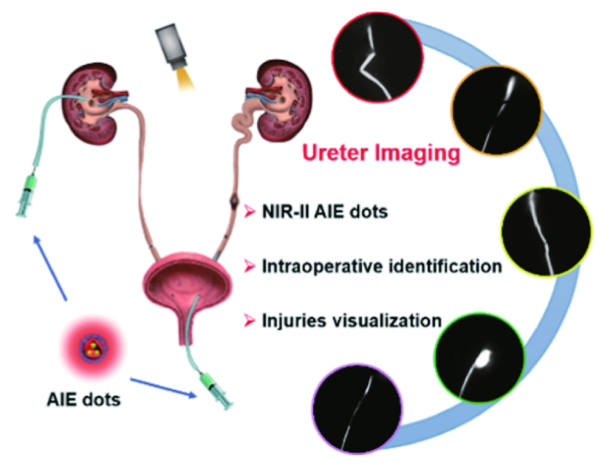
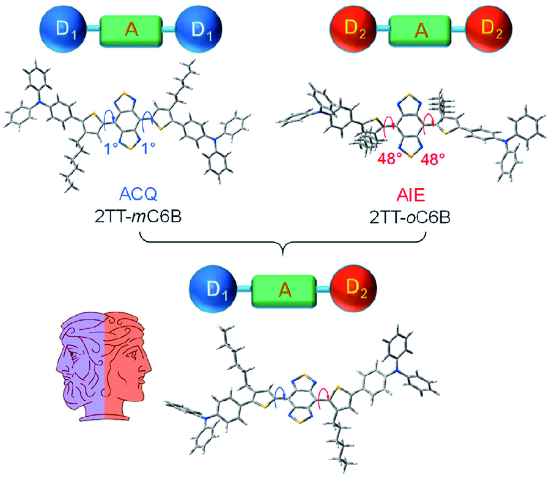
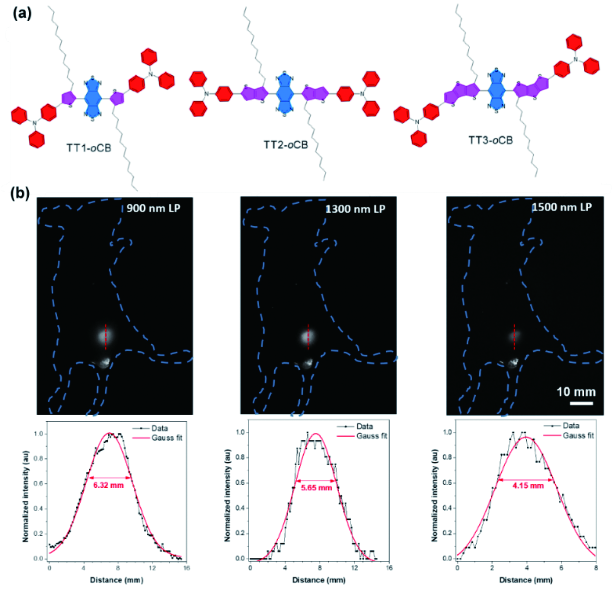
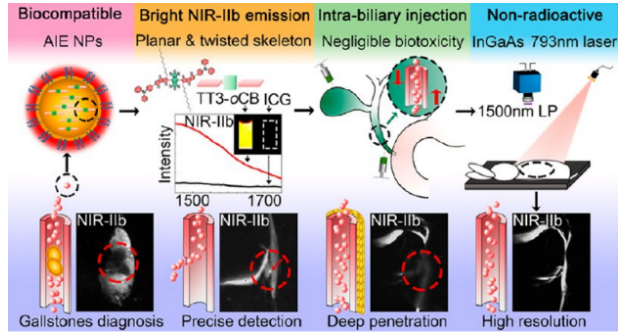
图156 (a) TT1-oCB、TT2-oCB与TT3-oCB的化学结构式;(b) 不同波段下利用TT3-oCB NPs进行的膀胱成像以及膀胱荧光信号的高斯拟合[606]Fig. 156 (a) Chemical structures of TT1-oCB, TT2-oCB and TT3-oCB; (b) Bladder NIR-Ⅱ imaging of living mice under different long-pass filters treated with TT3-oCB NPs and cross-sectional fluorescence intensity profile fitted with Gaussian along red-dashed lines[606] |
6.3.1.4 AIE NIR二区三光子成像
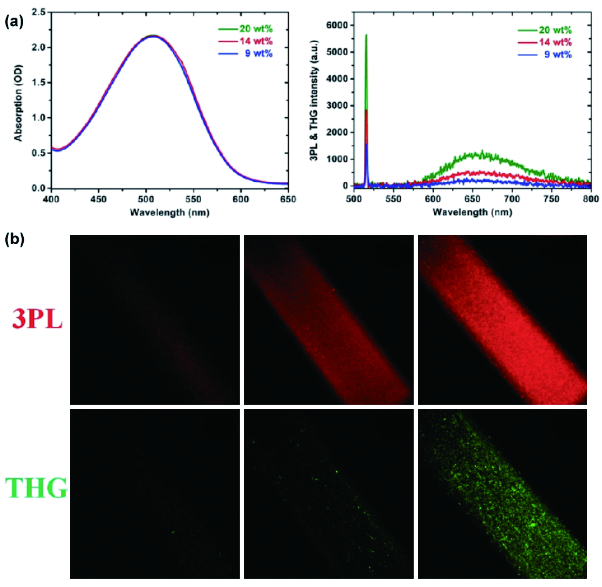
图159 (a) 不同TTF负载比NPs的吸收与1560 nm飞秒光激发三倍频、3PF比较;(b) 1560 nm飞秒激光激发不同TTF负载比溶液的3PF与三倍频成像(从左至右分别为9 wt%、14 wt%与20 wt%的负载比)[631]Fig. 159 (a) Quantitative comparison of 3PF and THG from TTF NPs with various TTF loading ratios; (b) 3PF and THG images of aqueous dispersion of TTF NPs in a capillary glass tube, with various TTF loading ratios (from left to right: 9 wt%, 14 wt%, and 20 wt%) under 1560 nm femtosecond laser[631] |
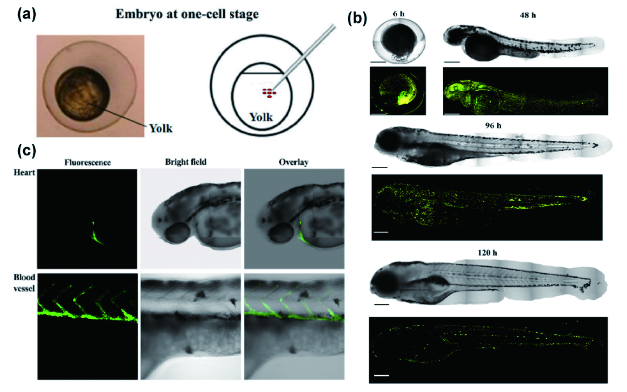
图161 (a) TTF NPs显微注射入斑马鱼胚胎的卵黄中;(b) 显微注射后6、48、96和120 h斑马鱼明场与1560 nm飞秒光激发3PF图像,标尺:200 μm;(c) 斑马鱼心脏与血管的3PF图像、明场图像以及相对应的叠加图像[628]Fig. 161 (a) Scheme illustrating the microinjection of TTF NPs into the yolk of zebrafish embryo; (b) bright field and 3PF images of zebrafish at 6, 48, 96 and 120 hours after microinjection of TTF NPs excited by a 1560 nm femtosecond laser, scale bar: 200 μm; (c) 3PF images, bright field images and overlay images of the heart and blood vessels of zebrafish[628] |

图162 小鼠脑血管3PF三维重构图。(a) 深度为875 μm的3D重构图;不同深度范围的3D重构图:(b) 0~200 μm, (c) 200~400 μm, (d) 400~600 μm and (e) 600~800 μm;标尺:200 μm[633]Fig. 162 3D reconstruction of the brain vascular system of a mouse. (a) 3D reconstruction with a penetration depth of 875 μm; 3D reconstruction at various depth regions, (b) 0~200 μm, (c) 200~400 μm, (d) 400~600 μm and (e) 600~800 μm; scale bar: 200 μm[633] |

图163 (a)~(f) 不同深度的小鼠脑血管3PF图像;(c)~(e) 中白色箭头旁的数值代表测量的血管直径;(g,f)图中虚线荧光强度的高斯拟合;(h) 深度1000~1200 μm之间皮质血管3PF三维重构图[634]Fig. 163 (a)~(f) 3PF images at various brain depth. The values beside the white arrows in (c)~(e) represent the measured diameters of blood vessels; (g) line plot of dashed line in (f). (h) 3D reconstruction of cortical vasculature in the depth range from 1000~1200 μm[634] |
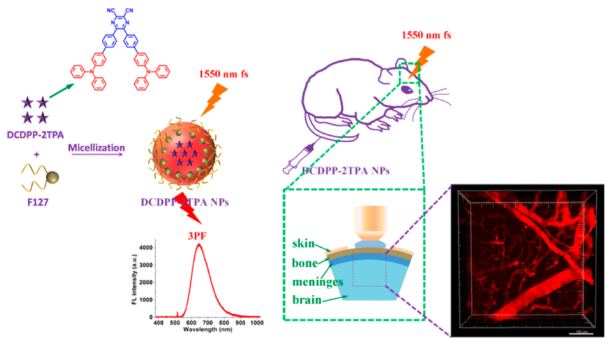
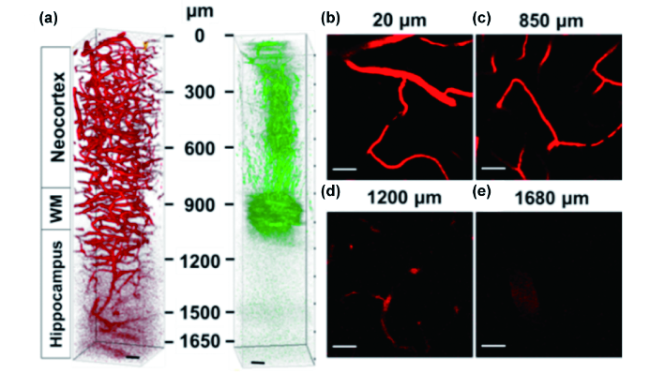
图165 小鼠脑血管3PF成像。(a) BONAPs标记的小鼠脑血管3PF(红色)与三倍频(绿色)三维重构图;(b)~(e) 深度分别为20、850、1200与1680 μm的3PF图像;标尺:50 μm[591]Fig. 165 Deep-brain 3PF imaging in mouse. (a) 3D reconstruction of 3PF imaging of the brain vasculature labeled by BONAPs (red) and simultaneously acquired third-harmonic generation imaging (green) to identify the anatomical layers; (b)~(e) 2D images from the 3D stack at 20 (b), 850 (c), 1200 (d) and 1680 (e) μm below the surface of the brain. WM: whiter matter. Scale bar: 50 μm[591] |
6.3.1.5 AIE光捕获荧光探针
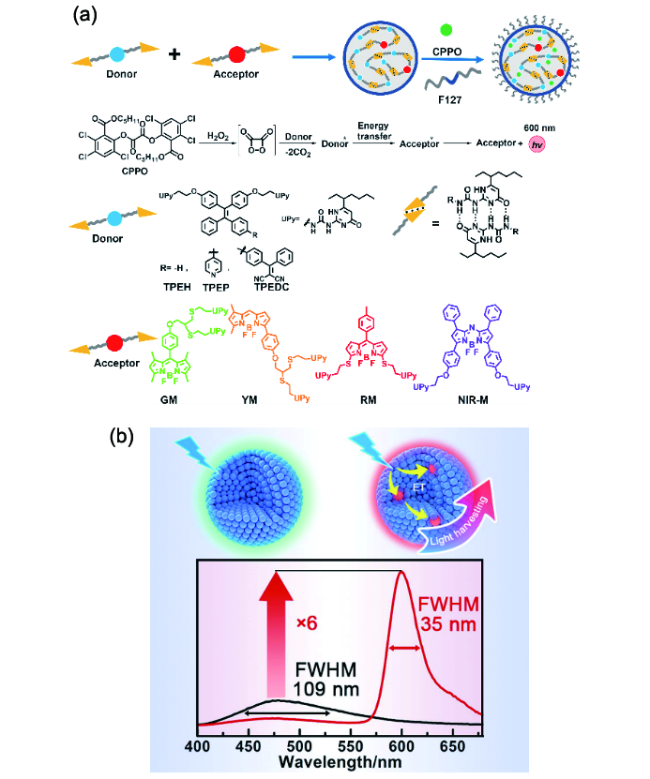
图166 (a)具有光捕获性能的AIE材料的制备示意图和纳米粒子修饰供受体的化学结构;(b)发光性能的控制[640]Fig. 166 (a) Schematic illustration of the preparation of AIE materials with light-harvesting properties, and chemical structures of the UPy-modified donors (TPEH, TPEP, and TPEDC) and acceptors (GM, YM, RM, and NIR-M). (b) Control of emission performance[640] |
6.3.2 AIE材料在生物诊疗方面的应用
6.3.2.1 调控AIE材料的荧光性能用于成像肿瘤切除

图167 (a) 纳米沉淀法制备Cor-AIE点和DSPE-AIE点的示意图;(b) Jablonski能级图显示了柔性(DSPE-AIE点)和刚性(Cor-AIE点)模型中AIEgens的非辐射、辐射和系间窜越(ISC)过程[641]Fig. 167 (a) Schematic illustration of the preparation of Cor-AIE dots and DSPE-AIE dots by nanoprecipitation method; (b) the Jablonski energy diagram of the nonradiative, radiative, and intersystem crossing processes for AIEgens in the flexible (DSPE-AIE dots) and rigid (Cor-AIE dots) models[641] |
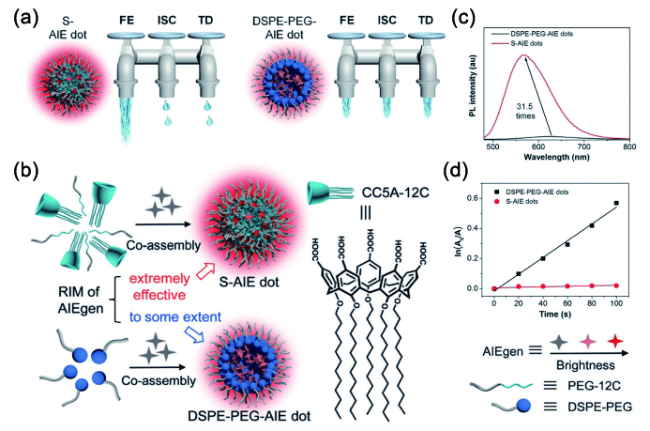
图168 (a) 能量耗散路径示意图;(b) 纳米粒子结构示意图;(c) 主客体掺杂的AIE纳米粒子和传统AIE纳米粒子在水中的荧光光谱;(d) 主客体掺杂的AIE纳米粒子和传统AIE纳米粒子ln(A0/A)随光照时间的变化曲线[642]Fig. 168 (a) The three dissipation pathways of the absorbed excitation energy for different AIE dots, which are likened to three water taps. FE: fluorescence emission; TD:thermal deactivation; (b) S-AIE dots and DSPE-PEGAIE dots and chemical structure of CC5A-12C; (c) Photoluminescence (PL) spectra of S-AIE dots and DSPE-PEG-AIE dots in water (λex: 445 nm); (d) Plot of ln(A0/A) against light irradiation time. A0 and A represent the ABDA absorbance at 378 nm without and with exposure to white light, respectively[642] |
6.3.2.2 光动力治疗


图173 (a) TPE-Py-FFGYSA的化学结构;(b) TPE-Py-Me的能量图、ROS产生途径以及HOMO-LUMO分布;(c) TPE-Py-FFGYSA作为佐剂协同紫杉醇抗肿瘤的机制示意图。HOMO:最高占位分子轨道;LUMO:最低未占位分子轨道;p-AKT:磷酸化蛋白激酶B;Cyt.C:细胞色素C;Pro-Caspase 3:半胱天冬酶-3前体[660]Fig. 173 (a) Chemical structure of TPE-Py-FFGYSA; (b) energy diagrams, the proposed pathway of ROS generation and HOMO-LUMO distributions of TPE-Py-Me; (c) schematic illustration of the proposed synergistic mechanism. HOMO: highest occupied molecular orbital; LUMO: lowest unoccupied molecular orbital; p-AKT: phospho-protein kinase B; Cyt.C: cytochrome C; Pro-Caspase 3:Pro-cysteinyl aspartate specific proteinase-3[660] |
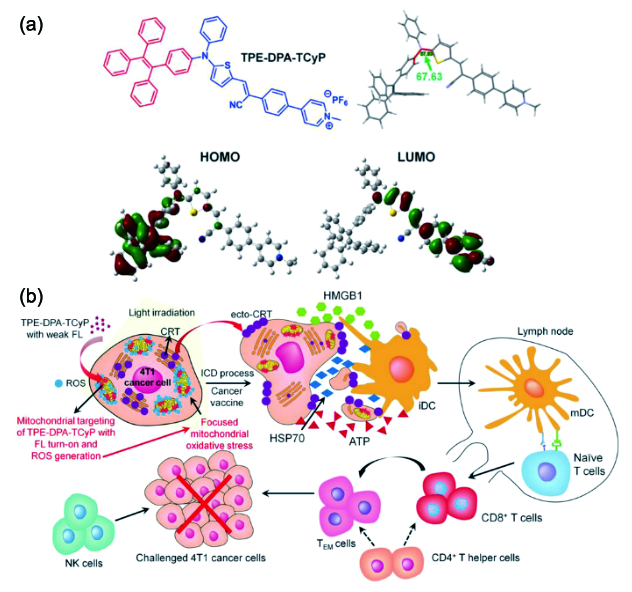
图174 (a) TPE-DPA-TCyP的化学结构、二面角以及HOMO-LUMO分布;(b) TPE-DPA-TCyP作为ICD诱导剂抗肿瘤的免疫机制示意图。HOMO:最高占位分子轨道;LUMO:最低未占位分子轨道;ICD:免疫原性死亡;CRT:钙网蛋白;ecto-CRT:转位至包膜外侧的钙网蛋白;HMGB1:迁移率族蛋白1;ATP:腺嘌呤核苷三磷酸;HSP70:热休克蛋白70;iDC:未成熟树突状细胞;mDC:成熟树突状细胞;TEM:效应/记忆T细胞[661]Fig. 174 (a) Chemical structures, dihedral angles, and HOMO-LUMO distributions of TPE-DPA-TCyP; (b) proposed mechanism of TPE-DPA-TCyP as an effective ICD inducer for antitumor immunity. HOMO: highest occupied molecular orbital; LUMO: lowest unoccupied molecular orbital; ICD: immunogenic cell death; CRT: calreticulin; ecto-CRT: surface-exposed CRT; HMGB1: high mobility group protein B1; ATP: adenosine triphosphate; HSP70: heat shock protein 70; iDC: immature dendritic cells; mDC: mature dendritic cells; TEM: effector memory T cells[661] |
6.3.2.3 光热治疗

图175 (a) AIE机理示意图; (b) 分子内运动诱导的光热转化(iMIPT)机理示意图; (c) 基于不同iMIPT分子的纳米颗粒在激光辐照下的温度随时间的变化曲线。激发波长:808 nm,辐照功率:0.8 W·cm-2,辐照时间:300 s; (d) 基于不同iMIPT分子的纳米颗粒的光声(PA)信号随波长的变化; (e) 静脉注射iMIPT纳米颗粒前后,肿瘤部位和正常组织的光声强度随时间的变化,插图:静脉注射4 h后肿瘤组织和正常组织的光声成像图片[668]Fig. 175 (a) Schematic illustration of aggregation-induced emission (AIE) mechanism; (b) schematic illustration of intramolecular motion-induced photothermy (iMIPT); (c) the temperature changes of solutions of various iMIPT nanoparticles (NPs) as a function of time. The solutions were irradiated with 808 nm laser for 300 s, power: 0.8 W·cm-2; (d) photoacoustic (PA) signal of NPs based on different iMIPT molecules varies with the wavelength; (e) PA intensity of tumor sites and normal tissues with time before and after intravenous injection of iMIPT NPs, inset: PA images of tumor and normal tissues at a time interval of 4 h after intravenous injection[668] |
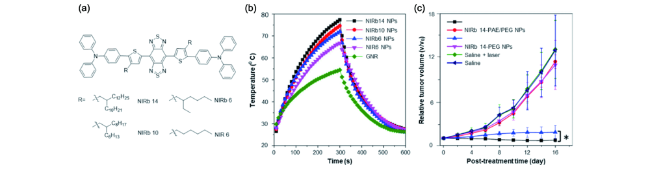
图176 (a) 基于iMIPT分子设计的近红外分子NIRb14、NIRb10、NIRb8、NIR6的分子结构; (b) 链长对iMIPT纳米颗粒的光热行为影响以及和金纳米棒的光热行为对比; (c) 不同条件处理下小鼠肿瘤生长曲线。PEG:聚乙二醇; PAE: β-聚氨酯。数据表达为,平均值±标准偏差(n=8),*p<0.05[672]Fig. 176 (a) Molecular structures of NIRB14, NIRB10, NIRB8 and NIR6 based on the molecular design of iMIPT; (b) the effect of chain length on the photothermal behavior of iMIPT NPs and the comparison of the photothermal behavior between iMIPT NPs and gold nanorods; (c) tumor growth curves of mice with different treatments. PEG: polyethylene glycol, PAE: poly(β-amino ester). In |

图177 (a) 基于iMIPT分子的类肺泡巨噬细胞纳米颗粒-TN@AM用于阻断冠状病毒进入细胞、光热杀灭病毒和吸收炎症细胞因子; (b) 分别用红细胞(RBC)膜包裹的iMIPT分子纳米颗粒、TN@AM纳米颗粒以及PBS处理的L929细胞中的MHV-A59病毒颗粒的数量。PBS: 磷酸缓冲盐溶液;纳米颗粒中蛋白浓度:4.0 mg·mL-1; (c) 分别用TN@AM NPs、RBC+NIR、NPs+NIR以及空白处理对小鼠进行治疗5天后用标准空斑实验测定的小鼠肺组织中MHV-A59浓度。b和c数据处理采取单项方差分析(One-way ANOVA )和Tukey事后比较法(Tukey post-hoc),*p<0.05,**p<0.01,***p<0.001, n.s.:不显著。c图数据为平均值+标准偏差,n=3[673]Fig. 177 (a) Schematic illustration of coronavirus cellular entry blockage, virus photothermal disruption, and inflammatory cytokines absorption by multifunctional alveolar macrophage-like nanoparticles-TN@AM NPs; (b) counts of MHV-A59 particle localization in single L929 cells with treatments of PBS, RBC NPs (4.0 mg·mL-1 protein concentration) and TN@AM NPs (4.0 mg·mL-1 protein concentration). L929 cells as the target cells, PBS: phosphate-buffered saline; RBC NPs: nanoparticles derived from red blood cell membranes; (c) detection of MHV-A59 burden in the lung tissues through a standard plaque assay after 5 days' different post-treatments. Statistical analysis of b and c was conducted by using one-way ANOVA followed by a Tukey post-hoc test,*p<0.05,**p<0.01,***p<0.001, n.s.=not significant. In |
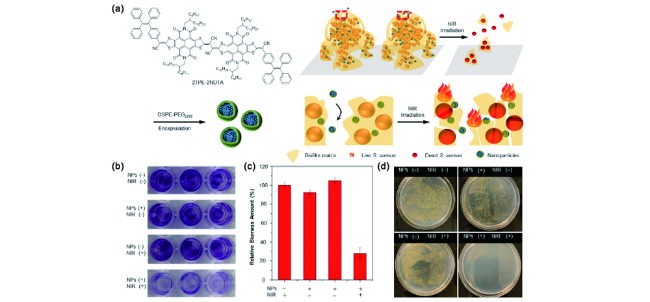
图178 (a) DSPE-PEG封装的2TPE-2NDTA纳米颗粒的制备及其通过光热去除成熟的细菌生物膜示意图;有无近红外激光辐照和有无纳米颗粒存在的条件下,0.1% w/w结晶紫染色的金黄色葡萄球菌照片(b),各组细菌生物膜的相对生物质量(c),金黄色葡萄球菌菌落在NB琼脂上的生长图片(d)[677]Fig. 178 (a) Schematic diagram of preparation of 2TPE-2NDTA NPs and eradication of mature bacterial biofilms by photothermal effect; (b) digital images of S. aureus biofilm stained with 0.1% (w/w) crystal violet after treated with or without near-infrared laser and nanoparticles; (c) relative biomass amount of each group; (d) Digital images of live S. aureus colonies grown on NB agar[677] |
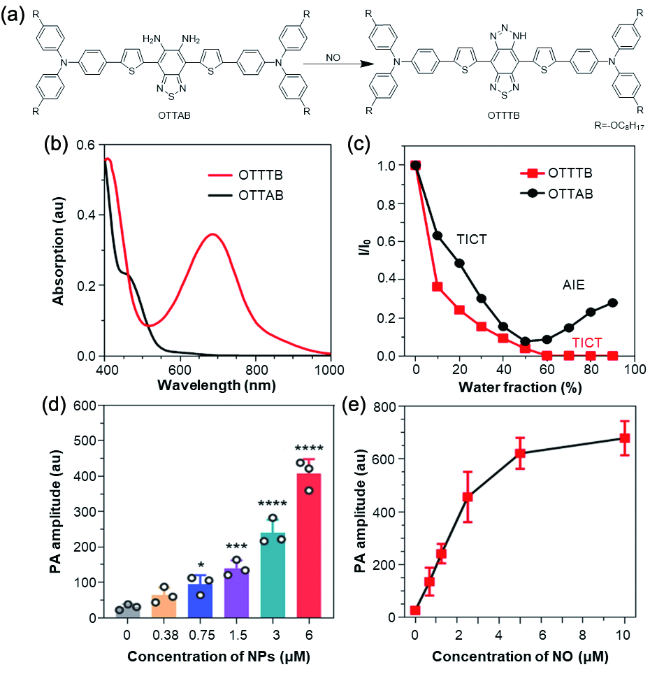
图179 (a) OTTAB检测NO的原理示意图;(b) OTTAB和OTTTB在四氢呋喃溶液中的吸收光谱,c=10-5 M;(c) 不同水含量下OTTTB和OTTAB在四氢呋喃/水混合溶液中的荧光强度的变化,c=10-5 M;(d) NO存在下,不同浓度OTTAB纳米颗粒的光声强度,数据表达为,平均值±标准偏差(n=3),*p=0.017,***p=0.00049,****p<0.0001;(e) 光声强度随NO浓度的变化曲线,数据表达为平均值±标准偏差(n=3)[680]Fig. 179 (a) The chemical mechanism of NO detection by OTTAB; (b) absorption spectra of OTTAB and OTTTB in tetrahydrofuran solution, c=10-5 M; (c) fluorescence intensity of OTTTB and OTTAB in tetrahydrofuran/water mixture with different water content, c=10-5 M; (d) in the presence of NO, the PA intensity of OTTAB NPs with different concentrations of OTTAB, data were presented as mean ± SD (n=3),*p=0.017,***p=0.00049,****p<0.0001; (e) the variation curve of PA intensity with NO concentration. Data were presented as mean ± SD (n=3)[680] |
6.3.2.4 AIE材料用于多模态光学诊疗
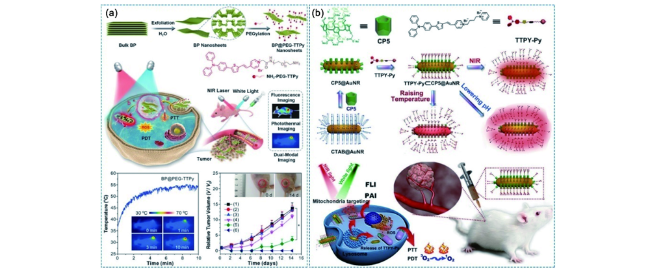
图180 基于AIE材料的无机材料辅助的多模态光学诊疗体系。(a)二维黑磷纳米片辅助的多模态光学诊疗体系[686];(b)金纳米棒辅助的柱芳烃超分子杂化的多模态光学诊疗体系[687]Fig. 180 AIEgen-based multimodal phototheranostic systems assisted by inorganic materials. (a) Multimodal phototheranostic system assisted by 2D black phosphorus nanosheets[686]. (b) Hybrid multimodal phototheranostic system assisted by pillar[5]arene-modified gold nanorods[687] |
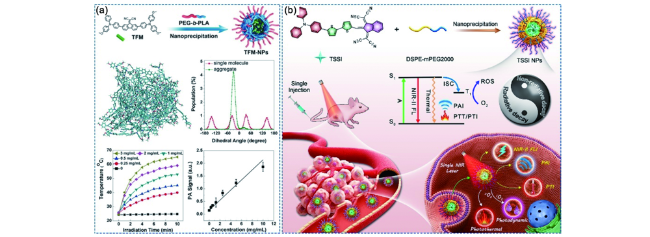
图181 基于单种AIE分子的多模态光学诊疗体系。(a) 促进分子在聚集态下杂乱无章堆积构建多模态光学诊疗体系[692];(b) 分子结构中引入振子构建多模态光学诊疗体系[693]Fig. 181 Single AIEgen-based multimodal phototheranostic systems. (a) Multimodal phototheranostic system based on the disordered loose packing in aggregate state[692]; (b) multimodal phototheranostic system based on the introduction of molecular vibrators[693] |