中文
Announcement
More
Progress in Chemistry 2022, Vol. 34 Issue (3): 743-772 DOI: 10.7536/PC210320 Previous Articles   

• Review •

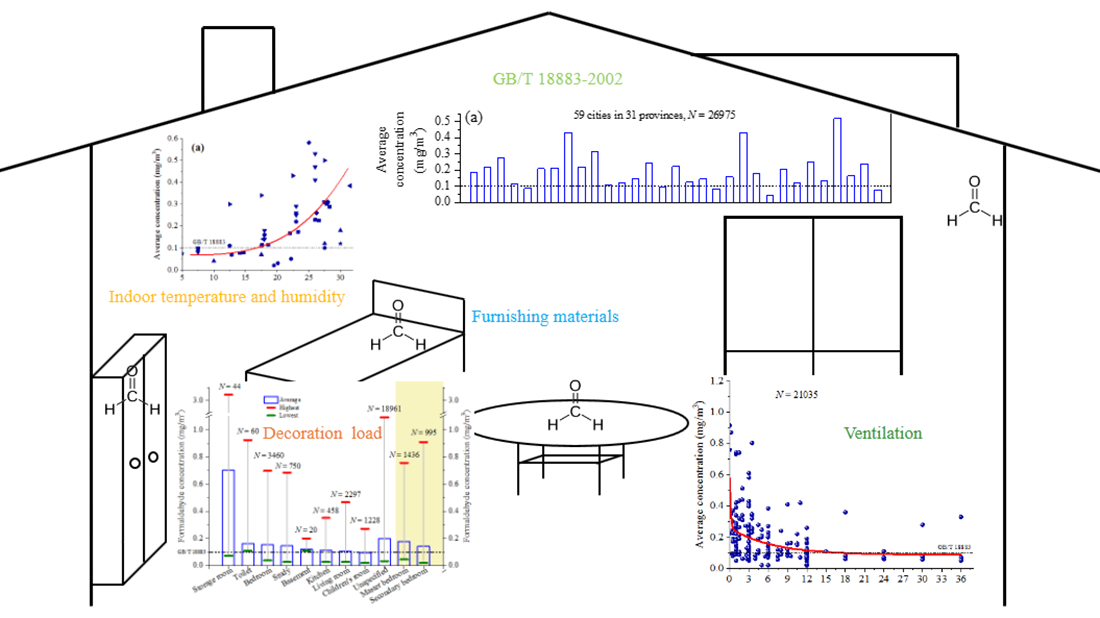
Indoor Formaldehyde Concentrations and the Influencing Factors in Urban China

Qiong Wang, Kang Xiao()   

  1. State Key Laboratory of Organic Electronics and Information Displays, School of Materials Science & Engineering, Nanjing University of Posts and Telecommunications, Nanjing 210023, China
  • Received: Revised: Online: Published:
  • Contact: Kang Xiao
  • Supported by:
    NUPTSF(NY 219057); Project for laboratory work of Nanjing University of Posts and Telecommunications(2020XSG11); Jiangsu Professional Brand Construction Project of ‘Polymer materials and engineering'(PZ03019007)
Richhtml ( 56 ) PDF ( 556 ) Cited
Export

EndNote

Ris

BibTeX

A dataset of indoor formaldehyde concentrations in more than 10394 decorated houses was collected from literature, containing 27384 rooms monitored from 2003 to 2018 with sample locations in 62 cities throughout 31 Chinese provinces. With respect to regional distribution, change pattern with years, indoor temperature and humidity, seasonal trend, room type, and the time after decoration, the indoor formaldehyde pollution status and the key factors that affect formaldehyde concentrations were analyzed. The results show that formaldehyde-polluted indoor air is widespread in China. Indoor formaldehyde concentrations largely exceeded the national standard GB/T 18883-2002 recommended limit, with most over-standard rates higher than 50%. Indoor formaldehyde concentrations decreased gradually from the enactment of the national standard GB/T 18883-2002 in 2002—2009; nevertheless, a reversal trend occurred from 2013, which demands further attention. Generally, higher indoor formaldehyde concentrations were found in rooms with higher indoor temperatures, more decoration loads, easily formaldehyde emission furnishing materials, a shorter time after decoration, and lower ventilation rates. Different trends of seasonal indoor formaldehyde concentrations were observed between the north and the south; however, whether in the north or in the south, indoor formaldehyde concentrations are higher in seasons with higher indoor temperatures and lower ventilation rates.

Contents

1 Introduction

2 Methods and dataset

3 About the dataset

4 Indoor formaldehyde pollution status

5 Influencing factors

5.1 Change patterns over the years

5.2 Influence of temperature and humidity

5.3 Seasonal trends

5.4 Influence of room type

5.5 Influence of time after decoration

6 Limitations

7 Conclusions

Fig.1 Flowchart of the bibliographic search
Table 1 The dataset details regarding indoor formaldehyde of decorated dwellings for 62 cities in 31 provinces in China
Province City
(location)a
Test year Test month/
Season
TS/℃b Methodc Number of samples Room type Time after
decoration/
monthd
Indoor formaldehyde concentration/mg· m - 3 e OSR/
%f
ref
Dwellings Rooms Aver. SD Lowest Highest
Beijing Beijing (N) 2007—2015 - - Interscan 4160
Followed HJ/T 167-2004
390 dwellings, 47 offices 2478 Dwellings 2050,
offices 428
>12 0.16 - - 1.39 50.8 15
Beijing (N) 2004—2014 - - Interscan 4160-19.99 51 41 Living room Newly 0.13 0.19 0.11 0.94 100 16
- 46 Bedroom Newly 0.24 0.22 0.13 1.10 100
- 15 Kitchen Newly 0.22 0.19 0.15 0.80 100
- 9 Dining room Newly 0.17 0.18 0.14 0.62 100
- 45 Toilet Newly 0.17 0.20 0.13 1.17 100
- 18 Study Newly 0.18 0.13 0.13 0.62 100
- 20 Basement Newly 0.12 0.06 0.11 0.20 100
Beijing (N) 2013 2 - DNPH 10 10 Living room - 0.0195 0.0136 0.0047 0.0426 0 17
2 Followed JIS A 1962 10 Children's room - 0.0151 0.0085 0.004 0.0312 0
9 - 10 10 Living room - 0.0315 0.0210 0.0138 0.0844 0
9 10 Children's room - 0.0269 0.0199 0.0118 0.0752 0
Beijing (N) 2003 Winter - AHMT 530 530 Dwelling <6 0.210 0.152 0.025 1.382 75.47 18
2003 Summer 389 389 Dwelling <6 0.278 0.211 0.025 1.879 91.26
2003 Winter - AHMT 155 155 Dwelling <6 0.210 0.165 0.025 1.382 71.61 18
2003 Summer 155 155 Dwelling <6 0.239 0.160 0.025 0.923 85.81
Beijing (N) 2009 Spring - Followed GB/T 18883-2002 48 48 Children's room >12 0.05 0.03 - - 4.17 19
Heilongjiang Daqing (N) 2013 1 - Interscan 4160 50 - Dwelling <1 0.37 - 0.08 2.75 64 20
- Dwelling 6 0.08 - 0 0.65 36
- Dwelling 12 0.03 - 0 0.20 12
Harbin (N) 2003 - Acac
Followed GB/T 15516-1995
110 - Dwelling - 0.30 - 0.05 1.20 87.3 21
Jilin Changchun (N) 2003 Winter - AHMT 201 - Dwelling <6 0.412 0.208 0.025 1.285 96.02 18
Changchun (N) 2006 3~8 - Interscan 4160 - 56 - <3 0.320 0.290 0.080 0.590 96 22
- 108 - 3~6 0.19 0.17 0.06 0.28 87
- 104 - 6~12 0.08 0.11 0.02 0.22 58
Liaoning Yingkou (N) 2006 5~6 - Acac 16 30 Children's room >12 0.098 - - 0.311 26.7 23
2007 5~6 Followed GB/T 15516-1995 14 28 Children's room >12 0.110 - - 0.46 25.0
2008 5~6 15 29 Children's room >12 0.118 - - 0.536 44.8
2009 5~6 12 24 Children's room >12 0.129 - - 0.631 37.5
2010 5~6 13 25 Children's room >12 0.093 - - 0.31 24.0
2011 5~6 11 22 Children's room >12 0.071 - - 0.368 18.2
Province City
(location)a
Test year Test month/
Season
TS/℃b Methodc Number of samples Room type Time after
decoration/
monthd
Indoor formaldehyde concentration/mg· m - 3 e OSR/
%f
ref
Dwellings Rooms Aver. SD Lowest Highest
2012 5~6 15 30 Children's room >12 0.063 - - 0.213 16.7
2013 5~6 9 18 Children's room >12 0.071 - - 0.242 11.1
2014 5~6 8 16 Children's room >12 0.090 - - 0.357 18.7
2015 5~6 11 22 Children's room >12 0.044 - - 0.079 0
Fushun (N) 2016 5~11 - MBTH 30 - Dwelling <24 - - 0.002 0.987 53.3 24
Followed GB/T 18204.26-
2000
30 - Dwelling 24~120 - - 0.001 0.097 13.3
Dalian (N) 2013 3 - DNPH 10 10 Living room - 0.0429 0.0412 0.008 0.1017 10 17
3 Followed JIS A 1962 10 Children's room - 0.0183 0.0047 0.0124 0.0238 0
7 10 10 Living room - 0.0591 0.0458 0.018 0.1532 20
7 10 Children's room - 0.0569 0.0575 0.0134 0.1587 20
Shenyang (N) 2006 4~11 - Acac 20 60 Dwelling 1 0.39 - 0.15 0.82 100 25
Followed GB/T 18883-2002 Dwelling 3 0.20 - 0.09 0.40 95
Dwelling 6 0.12 - 0.07 0.25 35
Shenyang (N) 2008-2009 - - F300-L 186 66 - <3 0.106 0.068 0.010 0.320 34.85 26
- 63 - 3~6 0.116 0.099 0.010 0.55 68.25
- 96 - 6~12 0.097 0.110 0.010 1.620 44.79
- 201 - 12~24 0.081 0.054 0.010 0.350 39.30
- 132 - 24~36 0.057 0.028 0.010 0.180 24.24
Tianjin Tianjin (N) before 2017 - - MBTH - 25 Master bedroom 0.5~6,
2.7 in average
0.09 - 0.01 0.37 28.00 27
- Followed GB/T 18204.26-
2000
- 23 Secondary bedroom 2.7 (0.5~6) 0.06 - 0 0.15 26.09
- - 17 Living room 2.7 (0.5~6) 0.08 - 0 0.27 29.41
- - 14 Kitchen 2.7 (0.5~6) 0.13 - 0.01 0.51 42.86
Inner Mongolia Baotou (N) 2014.10-2015.4 Heating season - DNPH 44 44 Children's room 81% <36
19% 36~60
0.227 0.0880 0.106g 0.396h 100 28
2015.4-2015.10 Nonheating season 42 42 Children's room 81% <36
19% 36~60
0.189 0.0755 0.0423g 0.305h 87.5
Xinjiang Urumqi (N) 2014-2016 - - Formaldemeter HTV 86 86 Living room <12~>60 0.117 - 0.040 0.389 48.8 29
- Followed HJ/T 167-2004 86 Master bedroom <12~>60 0.121 - 0.027 0.362 59.3
- 86 Secondary bedroom <12~>60 0.124 - 0.027 0.362 55.8
- 42 Study <12~>60 0.132 - 0.027 0.375 59.5
- 52 Kitchen <12~>60 0.134 - 0.040 0.375 63.5
Province City
(location)a
Test year Test month/
Season
TS/℃b Methodc Number of samples Room type Time after
decoration/
monthd
Indoor formaldehyde concentration/mg· m - 3 e OSR/
%f
ref
Dwellings Rooms Aver. SD Lowest Highest
Urumqi (N) 2002-2004 - - Followed GB/T 18883-2002 71 71 Dwelling Newly 0.42 - - 5.59 87.3 30
- 59 59 Dwelling <6 0.43 - - 3.17 79.7
- 46 46 Dwelling 6~12 0.41 - - 1.53 82.6
- 12 12 Dwelling 12~24 0.36 - - 1.07 75.0
- 10 10 Dwelling 24~36 0.28 - - 0.63 80.0
- 2 2 Dwelling >36 0.33 - - 0.63 50.0
Shihezi (N) 2018 3 - MBTH
Followed GB/T 18204.26-
2000
13 39 Dwelling <1 0.19 - 0.073 0.244 92.74 31
6 36 Dwelling 3 0.12 - 0.078 0.236 54.84
9 20 Dwelling 6 0.07 - 0.063 0.2135 11.76
Ningxia Shizuishan (N) 2003 Winter - AHMT 212 - Dwelling <6 0.610 0.311 0.104 1.712 100 18
2003 Summer 196 - <6 0.251 0.139 0.029 1.167 91.84
Shizuishan (N) 2003 Winter 25.0 AHMT 102 - Dwelling <6 0.581 0.292 0.104 1.712 100 18
2003 Summer 26.2 102 - <6 0.260 0.149 0.072 1.167 97.03
Qinghai Xining (N) 2005 1~5 - Acac
Followed GB/T 15516
128 - - - 0.192 - 0.008 0.48 62 32
Xining (N) 2007 1~5 - LC-01A 30 - - - 0.338 0.227 0.03 0.8 86.3 33
Gansu Lanzhou (N) 2011 7~12 - SJ-C1B 10 - - 1~3 0.34 - 0.1 1.5 90 34
10 - - 4~6 0.21 - 0.08 1.42 70
10 - - 7~9 0.09 - 0.07 1.33 40
10 - - 10~12 0.07 - 0.05 1.10 20
Lanzhou (N) 2011 7~12 10-15 SJ-C1B 10 - - - 0.30 - - - - 34
15-20 10 - - - 0.34 - - - -
20-25 10 - - - 0.43 - - - -
25-30 10 - - - 0.50 - - - -
>30 10 - - - 0.61 - - - -
Lanzhou (N) 2011 7-12 - SJ-C1B 15 15 Master bedroom - 0.45 - 0.08 1.42 40 34
15 Study - 0.42 - 0.07 1.08 33
15 Living room - 0.39 - 0.08 1.22 33
15 Kitchen - 0.33 - 0.07 1.02 26
15 Children's room - 0.12 - 0.05 1.03 20
15 Toilet - 0.14 - 0.04 0.19 13
Shaanxi Xi'an (N) 2010 - - Interscan 4160-2 - - Dwelling Newly 0.15 - - 2.84 71.6 35
2011 - Followed HJ/T 167-2004 - - Dwelling Newly 0.05 - - 0.68 61.2
2012 - - - Dwelling Newly 0.12 - - 1.26 53.8
2013 - - - Dwelling Newly 0.09 - - 0.86 54.9
Province City
(location)a
Test year Test month/
Season
TS/℃b Methodc Number of samples Room type Time after
decoration/
monthd
Indoor formaldehyde concentration/mg· m - 3 e OSR/
%f
ref
Dwellings Rooms Aver. SD Lowest Highest
2014 - - - Dwelling Newly 0.13 - - 0.47 54.5
2015 - - - Dwelling Newly 0.14 - - 0.56 81.6
Tibet Lhasa (N) 2013-2015 - - MBTH 42 - - - 0.120 0.055 - - 31 14,36
Sichuan Nanchong (S) 2012-2014 - - Interscan 4160 65 65 Living room <12 0.09i - 0.02 0.32 24.6 37
- 65 Master bedroom <12 0.12i - 0.05 0.38 35.4
- 65 Secondary bedroom <12 0.10i - 0.04 0.30 27.7
- 35 Study <12 0.13i - 0.02 0.41 42.8
- 65 Kitchen <12 0.05i - 0.02 0.12 15.4
Nanchong (S) 2012-2014 - - Interscan 4160 10 50 Dwelling 1 0.34 0.12 - - 100 37
- 2 0.44 0.21 - - 96
- 3 0.28 0.11 - - 65.4
- 6 0.14 0.08 - - 25
- 9 0.12 0.06 - - 21.2
- 12 0.09 0.03 - - 12.2
Nanchong (S) 2012-2014 - <10 Interscan 4160 65 65 Living room - 0.04i - 0.03 0.12 4.6 37
- 10~25 - 0.07i - 0.02 0.16 7.7
- 25~30 - 0.12i - 0.04 0.28 24.6
- >30 - 0.18i - 0.06 0.32 44.6
Nanchong (S) 2011 - - MBTH - 101 Dwelling 3~18 0.22 - 0.02 0.94 77.8 38
2012 - Followed GB/T 18204.26-
2000
- 95 Dwelling 3~18 0.16 - 0.01 1.12 48.4
2013 - - 49 Dwelling 3~18 0.15 - 0.05 0.61 46.9
Chengdu (S) 2008 - - MBTH 80 80 Living room Newly 0.153 - 0.042 0.415 79 39
- Followed GB/T 18204.26-
2000
80 Master bedroom Newly 0.192 - 0.042 0.559 91
- 80 Secondary bedroom Newly 0.182 - 0.037 0.551 89
Chengdu (S) 2010.9-2011.6 - - MBTH 96 96 Living room <6 0.11 0.06 0.04 0.32 38.5 40
- Followed GB/T 18204.26-
2000
96 Master bedroom <6 0.12 0.09 0.02 0.54 47.9
- 75 Study <6 0.10 0.07 0.02 0.32 40.0
- 64 Children's room <6 0.10 0.05 0.02 0.30 39
- 90 Secondary bedroom <6 0.12 0.07 0.02 0.38 46.7
Chengdu (S) 2010.9-2011.6 - <10 MBTH - 79 Dwelling <6 0.074 - 0.02 0.24 21.0 40
- 10~25 Followed GB/T 18204.26-
2000
- 292 Dwelling <6 0.110 - 0.02 0.54 40.0
- >25 - 110 Dwelling <6 0.120 - 0.03 0.32 60.8
Chongqing Chongqing (S) 2003 Winter - AHMT 198 198 - <6 0.142 0.084 0.025 0.461 64.65 18
2003 Summer 202 202 - <6 0.397 0.172 0.121 1.182 100
Chongqing (S) 2003 Winter 17.8 AHMT 101 101 - <6 0.140 0.079 0.025 0.461 68.31 18
Province City
(location)a
Test year Test month/
Season
TS/℃b Methodc Number of samples Room type Time after
decoration/
monthd
Indoor formaldehyde concentration/mg· m - 3 e OSR/
%f
ref
Dwellings Rooms Aver. SD Lowest Highest
2003 Summer 31.5 - <12 0.384 0.161 0.121 0.946 100
Chongqing (S) 2008 3-12 - Followed HJ/T 167-2004 37 84 Bedroom <6 0.174 0.14 0.006 0.603 63.1 41
20 Study <6 0.170 0.17 0.027 0.634 50.0
37 Living room <6 0.120 0.10 0.002 0.438 47.0
37 Kitchen <6 0.113 0.06 0.018 0.212 40.0
Guizhou Guiyang (S) 2004.3-2005.1 - - Interscan-4160 74 - Living room - 0.06 0.03 0.01 0.17 - 42
Calibrated against
GB/T 16129
- Bedroom - 0.06 0.02 0.01 0.15
- Kitchen - 0.06 0.04 0.01 0.27
Guiyang (S) 2009.5-2011.5 - - AHMT 8 - Low decoration load <0.5 0.095i - 0.049 0.17 12.5 43
- Followed GB/T 16129-1995 8 - Medium decoration load <0.5 0.24i - 0.072 0.46 62.5
- 8 - High decoration load <0.5 0.87i - 0.47 1.71 100
Yunnan Kunming (S) 2005-2007 - - MBTH Followed
GB/T 15516-1995
48 48 - - 0.26 - 0.04 0.74 91.7 44
Kunming (S) 2004 Winter - - 10 - - - 0.0337 - 0.0194 0.0823 0 45
Honghe Prefecture (S) 2005 7, 10 - Followed GB/T18204.26-
2000
11 33 - Newly - - 0.111 1.38 100 46
Shanxi Taiyuan (N) 2003-2005 - - GDYQ-201MB 20 - - <1 0.18 - - 0.38 95 47
- 20 - - 1~12 0.23 - - 0.56 90
- 20 - - 12~36 0.11 - - 0.21 85
- 20 - - >36 0.07 - - 1.01 50
Linfen (N) - - - - - 100 Living room - 0.111 - 0.040 0.388 53 48
- - - 100 Master bedroom - 0.129 - 0.042 0.418 62
- - - 100 Secondary bedroom - 0.117 - 0.035 0.410 51
Hebei Shijiazhuang (N) 2006-2010 - - Followed GB/T 18883-2002 506 - Dwelling - 0.144 - - 0.907 48.81 49
Shandong Ji'nan (N) 2011.2-2012.8 - - MBTH 71 142 Bedroom 0~6 0.09i - 0.03 0.28 44.4 50
- Followed GB/T 18204.26-
2000
71 Living room 0~6 0.06i - 0.02 0.18 35.2
- 39 Study 0~6 0.12i - 0.06 0.23 56.4
- 38 Dining room 0~6 0.05i - 0.02 0.14 34.2
- 36 Kitchen 0~6 0.05i - 0.02 0.12 16.7
Ji'nan (N) 2011.2-2012.8 1~3 - MBTH - 41 - 0~6 0.04i - 0.02 0.13 31.7 50
4~6 Followed GB/T 18204.26-
2000
96 - 0~6 0.09i - 0.03 0.24 41.7
7~9 109 - 0~6 0.12i - 0.04 0.28 53.2
10~12 80 - 0~6 0.05i - 0.02 0.15 22.5
Province City
(location)a
Test year Test month/
Season
TS/℃b Methodc Number of samples Room type Time after
decoration/
monthd
Indoor formaldehyde concentration/mg· m - 3 e OSR/
%f
ref
Dwellings Rooms Aver. SD Lowest Highest
Henan Luoyang (N) 2015 3~12 - Interscan 4160-2 120 45 Study, bedroom,
living room
<3 0.1072 - 0.0402 0.9514 62.22 51
121 3~12 0.0804 - 0.0268 0.8576 36.36
116 12~36 0.0670 - 0.0134 0.7772 23.28
130 >36 0.0536 - 0.0134 0.8308 13.85
Luoyang (N) 2015 3~12 - Interscan 4160-2 120 172 Living room - 0.0670 - 0.0134 0.7772 26.74 51
120 Study - 0.0670 - 0.0134 0.7906 30.00
120 Bedroom - 0.0670 - 0.0134 0.9514 29.17
Luoyang (N) 2008 3~10 - Interscan 4160-2 76 32 - <1 0.08 - 0.06 0.68 - 52
178 - 2~6 0.08 - 0.04 0.54 -
186 - 7~12 0.08 - 0.04 0.41 -
147 - >12 0.08 - 0.019 0.20 -
Nanyang (N) 2013 3~11 - SKS-BY-CH2O 154 24 Bedroom <3 0.433 - 0.267 0.586 100 53
128 Bedroom 3~6 0.279 - 0.076 0.441 95.7
81 Bedroom 6~12 0.159 - 0.055 0.339 83.3
26 Bedroom 12~18 0.109 - 0.032 0.234 56.1
15 Living room <3 - - 0.178 0.579 100
80 Living room 3~6 - - 0.069 0.340 91.2
47 Living room 6~12 - - 0.023 0.177 66.7
12 Living room 12~18 - - 0.005 0.145 41.7
Xinxiang (N) 2009-2011 - - MBTH 22 10 Bedroom, living room <1 0.096i - 0.081 0.169 100 54
- Followed GB/T 18204.26-
2000
15 1~2 0.086i - 0.060 0.096 80
- 21 3~5 0.062i - 0.032 0.091 47.62
- 12 6~9 0.057i - 0.022 0.087 25
Anyang (N) 2008 7~10 - MBTH - 103 - 1 0.29 0.023 0.03 0.96 86.41 55
Followed GB/T 18204.26-
2000
348 - 3 0.24 0.025 0.04 0.89 84.20
89 - 6 0.21 0.025 0.06 0.83 57.30
64 - 12 0.11 0.006 0.04 0.23 29.69
21 - >12 0.06 0.003 0.02 0.14 14.29
Sanmenxia (N) 2007 1~12 - GDYQ-201MB 9 27 - 1~3 0.31 - 0.08 0.64 88.9 56
Followed GB/T 18204.26-
2000
27 81 - 4~6 0.20 - 0.05 0.43 85.1
16 48 - 7~9 0.24 - 0.05 0.61 81.3
5 15 - 10~12 0.42 - 0.08 0.82 80
Province City
(location)a
Test year Test month/
Season
TS/℃b Methodc Number of samples Room type Time after
decoration/
monthd
Indoor formaldehyde concentration/mg· m - 3 e OSR/
%f
ref
Dwellings Rooms Aver. SD Lowest Highest
25 75 - 12~120 0.23 - 0.05 0.70 92
Sanmenxia (N) 2007 1~12 10~15 GDYQ-201MB 12 36 - - 0.11 - 0.05 0.17 58.3 56
16~20 Followed GB/T 18204.26-
2000
20 60 - - 0.16 - 0.06 0.33 85.0
21~25 19 57 - - 0.22 - 0.05 0.62 84.2
>26 31 93 - - 0.31 - 0.05 0.67 90.3
Anhui Chuzhou (S) 2002.12-2003.6 - - Chromotropic acid 12 dwellings, 6 offices 36 Doors and
windows closed
Newly 0.731 0.317 - - 100 57
Doors and
windows open
Newly 0.134 0.073 - - 100
Jiangsu Wuxi (S) 2009 1~12 - Interscan-HTV
Followed GB/T 18204.26-
2000
18 54 Bedroom, living room 3 0.13 0.16 - - 31.79 58
2010 19 57 3 0.06 0.06 - - 19.30
2011 10 30 3 0.06 0.05 - - 13.33
2012 22 66 3 0.06 0.03 - - 7.58
2013 15 45 3 0.07 0.08 - - 17.78
Huaian (S) 2014-2015 - - MBTH Followed
GB/T 18204.2-2014
28 24 Living room,
bedroom, study
<3 0.19 - 0.01 0.56 45.8 59
- 36 3~12 0.12 - 0.05 0.49 27.8
- 30 >12 0.06 - 0.03 0.40 16.7
Huaian (S) 2014-2015 - - MBTH 28 24 Living room - 0.11 - - - 33.3 59
- Followed GB/T 18204.2-
2014
24 Master bedroom - 0.16 - - - 41.7
- 28 Secondary bedroom - 0.14 - - - 39.3
- 14 Children's room - 0.24 - - - 57.1
Nanjing (S) 2002-2004 - - AHMT
Followed GB/T 18883-2002
427 1281 Living room,
bedroom, study
<12 0.20 0.17 - - - 60
Shanghai Shanghai (S) 2013-2014 Spring - Shinyei detector 409 118 Children's room >12 0.0204 0.0103 0.0092 0.0732 0 61
Summer 110 >12 0.0197 0.0179 0.0068 0.1107 0.91
Autumn 92 >12 0.0192 0.0126 0.0068 0.1097 0.11
Winter 89 >12 0.0277 0.0058 0.0128 0.0530 0
Shanghai (S) 2011.10-2012.11 - - XP-308 84 84 Living room - 0.065 0.007 0.016j 0.075k 15.48 62
- 162 Bedroom - 0.076 0.005 0.034j 0.100k 22.84
- 42 Study - 0.085 0.011 0.038j 0.116k 26.19
Province City
(location)a
Test year Test month/
Season
TS/℃b Methodc Number of samples Room type Time after
decoration/
monthd
Indoor formaldehyde concentration/mg· m - 3 e OSR/
%f
ref
Dwellings Rooms Aver. SD Lowest Highest
Shanghai (S) 2011.10-2012.11 - - XP-308 84 17 - <4 0.062 0.014 0.019j 0.075k 11.76 62
- 26 - 4~12 0.117 0.016 0.050j 0.175k 46.15
- 43 - 13~24 0.061 0.008 0.013j 0.088k 13.95
- 166 - 25~36 0.076 0.005 0.034j 0.100k 22.29
- 36 - >36 0.055 0.006 0.013j 0.075k 11.11
Shanghai (S) 2013 1 - DNPH 21 21 Living room - 0.0134 0.0063 0.0042 0.031 0 17
1 Followed JIS A 1962 21 Children's room - 0.0143 0.0058 0.0061 0.0291 0
8 19 19 Living room - 0.0525 0.0275 0.0038 0.1107 5.3
8 19 Children's room - 0.0658 0.0414 0.0102 0.1623 15.8
Hubei Wuhan (S) 2013 10 - DNPH 10 10 Living room - 0.0162 0.0045 0.0104 0.0237 0 17
10 Followed JIS A 1962 10 Children's room - 0.0217 0.0086 0.0112 0.0325 0
12 7 7 Living room - 0.0110 0.0155 0.0005 0.0452 0
12 7 Children's room - 0.0147 0.0118 0.006 0.0386 0
Wuhan (S) 2009 3~5 - Followed GB/T 18883-2002 78 78 Children's room >12 0.26 0.17 - - 88.46 19
Wuhan (S) 2005 4 - AHMT 66 66 - 0 0.227 0.138 0.023 0.901 90.9 63
5 Followed GB/T 16129-1995 65 65 - 0.5 0.225 0.187 0.043 1.021 78.5
6 63 63 - 1.5 0.214 0.180 0.013 0.941 73.0
7 62 62 - 2.5 0.272 0.218 0.019 0.902 75.8
8 63 63 - 3.5 0.230 0.150 0.011 0.635 76.2
9 64 64 - 4.5 0.098 0.072 0.013 0.381 37.5
10 64 64 - 5.5 0.078 0.050 0.010 0.265 29.7
Shiyan (S) 2006 - - Interscan 4160 30 - - <12 0.27 - - - 78 64
- 15 - - Undecorated 0.04 - - - 4
Shiyan (S) 2006 - - Interscan 4160 10 - - 0 0.76 - - - 100 64
- - - 1 0.39 - - - 100
- - - 3 0.22 - - - 54
- - - 6 0.08 - - - 12
Hunan Changsha (S) 2014 1 - DNPH 10 10 Living room - 0.0078 0.0018 0.005 0.0114 0 17
1 Followed JIS A 1962 10 Children's room - 0.0078 0.0012 0.0059 0.0238 0
2013 10 10 10 Living room - 0.0121 0.0051 0.0011 0.0193 0
10 10 Children's room - 0.0180 0.0109 0.0066 0.0381 0
Changsha (S) 2008.11-2009.10 - - Interscan 4160-19.99
Fulfilled the criteria of
GB/T 18883-2002 and
GB 50325-2001
83 149 Dwelling 1~6 - - 0.01 0.45 67.79 65
195 7~24 - - 0.01 0.31 42.56
-
Province City
(location)a
Test year Test month/
Season
TS/℃b Methodc Number of samples Room type Time after
decoration/
monthd
Indoor formaldehyde concentration/mg· m - 3 e OSR/
%f
ref
Dwellings Rooms Aver. SD Lowest Highest
Changsha (S) 2008.11-2009.10 - - Interscan 4160-19.99
Fulfilled the criteria of
GB/T 18883-2002 and
GB 50325-2001
83 80 Living room - 0.08 0.05 0.01 0.26 33.75 65
82 Master bedroom - 0.12 0.07 0.01 0.40 60.98
62 Study - 0.12 0.08 0.01 0.40 56.45
74 Children's room - 0.13 0.09 0.01 0.45 63.51
46 Secondary bedroom - 0.12 0.07 0.02 0.31 54.35
Zhuzhou (S) - - - Acac 73 21 - <3 0.264 0.084 - - 90.5 66
- - 20 - 4~6 0.247 0.076 - - 80.0
- - 15 - 7~12 0.163 0.054 - - 46.6
- - 17 - >12 0.104 0.035 - - 29.4
- - 10 10 - undecorated 0.065 0.013 - - 0
Jiangxi Nanchang (S) 2012-2013 - - Interscan 4160-2 65 220 Dwelling Newly - - 0.01 0.28 66.8 67
Jiangxi (S)l 2004-2005 - Followed GB/T 18204.26
and HJ/T 167-2004
- 563 - - 0.25 - 0.006 3.39 76.20 68
Zhejiang Hangzhou (S) 2007 1~12 - MBTH 1598 557 - <12 0.149 0.111 0.006 0.664 66.1 69
2008 1~12 Followed GB/T 18204.26-
2000
980 - <12 0.109 0.096 0.005 0.739 37.8
2009 1~12 787 - <12 0.074 0.064 0.010 0.776 21.2
Wenzhou (S) 2007 4~5 - ESC Z-300P 50 50 Master bedroom 1~6 0.3418 0.2943 0.03 1.01 84.0 70
42 Children's room 1~6 0.3191 0.2841 0.02 1.13 78.6
50 Living room 1~6 0.2588 0.2616 0.02 0.94 58.0
31 Study 1~6 0.3474 0.2643 0.03 0.97 87.1
50 Kitchen 1~6 0.2516 0.2529 0.03 0.87 62.0
38 Storage room 1~6 0.8024 0.7183 0.08 3.51 100
Fujian Fuzhou (S) 2004.2-2005.2 - - MBTH Followed
GB/T 18204.26-2000
36 113 - <3 0.74 - 0 3.92 62.8 71
Fuzhou (S) 2003 5~10 - MBTH 15 15 - 0 0.915 0.247 0.57 1.25 100 72
Followed GB/T 18204.26-
2000
- 1 0.742 0.143 0.49 0.98 100
- 2 0.513 0.105 0.35 0.66 100
- 3 0.251 0.065 0.17 0.34 100
- 4 0.084 0.040 0.02 0.15 -
- 5 0.02 0.07 0.048 0.013 -
Nanping (S) 2004.11-2005.1 Winter - Acac
Followed GB/T 15516
32 32 - 0~12 0.020 - 0.008 0.070 0 73
Guangxi Nanning (S) 2004 - - MBTH - 180 - Newly 0.260 0.238 0.0081 1.32 73.9 74
Province City
(location)a
Test year Test month/
Season
TS/℃b Methodc Number of samples Room type Time after
decoration/
monthd
Indoor formaldehyde concentration/mg· m - 3 e OSR/
%f
ref
Dwellings Rooms Aver. SD Lowest Highest
2005 - Followed GB/T 18204.26-
2000
268 - Newly 0.280 0.244 0.01 1.6 74.3
2006 - 217 - Newly 0.133 0.176 0.01 2.1 42.4
2007 - 166 - Newly 0.130 0.119 0.018 0.56 42.2
2008 - 192 - Newly 0.128 0.0953 0.014 0.43 41.7
2009 - 178 - Newly 0.128 0.136 0.012 0.64 38.2
2010 - 116 - Newly 0.105 0.0660 0.02 0.43 36.2
2011 - 120 - Newly 0.120 0.0970 0.007 0.45 35.8
Nanning (S) 2004-2011 1 12.8 MBTH - 183 - Newly 0.0697 0.0723 0.0100 0.290 18.6 74
2 14.1 Followed GB/T 18204.26-
2000
116 - Newly 0.0700 0.0546 0.0200 0.370 18.1
3 17.6 104 - Newly 0.113 0.138 0.00700 0.800 27.9
4 22.0 172 - Newly 0.167 0.138 0.0100 0.510 59.3
5 26.0 90 - Newly 0.228 0.205 0.0320 0.980 71.1
6 27.4 108 - Newly 0.309 0.302 0.0150 2.10 80.6
7 28.3 113 - Newly 0.288 0.264 0.0490 1.32 81.4
8 27.8 108 - Newly 0.301 0.260 0.0140 1.20 81.5
9 26.6 106 - Newly 0.225 0.176 0.0200 0.870 70.8
10 23.3 112 - Newly 0.174 0.187 0.0220 0.880 67.9
11 18.6 118 - Newly 0.114 0.0848 0.0160 0.350 27.1
12 14.7 107 - Newly 0.0785 0.0610 0.0120 0.290 25.2
Nanning (S) 2004-2011 - - MBTH - 406 Living room Newly 0.151 0.154 0.0120 1.00 45.6 74
- Followed GB/T 18204.26-
2000
410 Master bedroom Newly 0.184 0.186 0.00700 1.51 54.9
- 405 Secondary bedroom Newly 0.163 0.170 0.00810 1.60 50.9
- 133 Study Newly 0.191 0.194 0.0100 1.320 57.1
Nanning (S) ~2013-2014 - - PPM-400ST 30 42 Living room <24 0.065 0.031 0.001 0.176 28.6 75
- 42 Bedroom <24 0.171 0.073 0.016 0.560 73.8
- 42 Study <24 0.192 0.066 0.013 0.901 76.2
Nanning (S) 2013-2014 - - MBTH 40 39 Living room - 0.11 - 0.01 0.72 30.8 76
- Followed GB/T 18204.26 40 Master bedroom - 0.12 - 0.02 0.53 37.5
- 33 Study - 0.15 - 0.02 0.80 36.4
- 72 Secondary bedroom - 0.12 - 0.01 0.61 33.3
- 6 Storage room - 0.07 - 0.02 0.09 0
Guangdong Guangzhou (S) 2014 - - Acac 400 - - 6~72 0.37 - - 2.50 80.2 77
Province City
(location)a
Test year Test month/
Season
TS/℃b Methodc Number of samples Room type Time after
decoration/
monthd
Indoor formaldehyde concentration/mg· m - 3 e OSR/
%f
ref
Dwellings Rooms Aver. SD Lowest Highest
2015 - - 6~72 0.30 - - 0.50 89.4
2016 - - 6~72 0.21 - - 0.44 74.6
2017 - - 6~72 0.24 - - 0.37 74.0
2018 - - 6~72 0.25 - - 0.57 72.4
Shunde (S) ~2014 - - MBTH 48 40 Living room - 0.07 - 0.04 0.26 65 78
- Followed GB/T 18204.26 48 Master bedroom - 0.18 - 0.05 0.43 72.9
- 37 Children's room - 0.13 - 0.03 0.48 78.4
- 43 Study - 0.15 - 0.05 0.39 74.4
- 41 Master bedroom undecorated 0.03 - 0.01 0.05 0
- 37 Master bedroom 0 dm 0.38 - 0.22 0.57 100
- 40 Master bedroom 7 dm 0.35 - 0.21 0.47 100
- 38 Master bedroom 15 dm 0.30 - 0.18 0.45 100
- 41 Master bedroom 30 dm 0.27 - 0.16 0.38 100
- 40 Master bedroom 3 0.13 - 0.08 0.22 62.5
- 40 Master bedroom 6 0.16 - 0.06 0.25 65
- 38 Master bedroom 12 0.12 - 0.05 0.18 21.1
Zhongshan (S) 2013-2014 - - Interscan 4160 35 35 Dwelling <3 0.103 0.110 0.020 0.576 28.75 79
Zhaoqing (S) 2008-2011 - Followed GB/T 18204.26-
2000
100 100 - <1 0.172 0.092 - - 90.13 80
- 95 - >12 0.074 0.065 - - 11.79
- 93 - >24 0.060 0.059 - - 9.27
Hainan Haikou (S) 2015 5 - PPM-400ST 100 46 Living room <12 0.089 0.053 0.011 0.257 52.2 81
46 Kitchen <12 0.093 0.065 0.013 0.340 47.8
46 Bedroom <12 0.097 0.067 0.018 0.313 47.8
28 Living room 12~36 0.068 0.031 0.009 0.142 46.4
28 Kitchen 12~36 0.069 0.027 0.018 0.147 39.3
28 Bedroom 12~36 0.070 0.028 0.019 0.147 32.1
26 Living room >36 0.051 0.024 0.017 0.097 23.1
26 Kitchen >36 0.050 0.028 0.014 0.121 11.5
26 Bedroom >36 0.052 0.028 0.010 0.100 23.1
Fig.2 Distributions of rooms with different sampling methods for the collected data. (a) Total distribution, (b) sensors, and (c) derivatization methods. NA: Not available
Table 2 Standards and the corresponding methods for indoor formaldehyde determinationa
Fig.3 Distribution of (a) indoor formaldehyde average concentrations, (b) the highest concentrations, and (c) over-standard rates in 31 Chinese provinces. Data were calculated from Table 1. N denotes the sample size. NA means no data in the corresponding province. The average concentration, highest concentration, and over-standard rate in each province were the weighted averages of samples in the corresponding province: Yprovince = ∑iNiYi/∑iNi, where Ni and Yi denote the ith sample size and ith sample value, respectively, within the corresponding province in Table 1.
Fig.4 (a) Change patterns of indoor formaldehyde average concentrations, the lowest concentrations, and the highest concentrations over the years; (b) Change pattern of over-standard rates over the years. N denotes the sample size. Data we adopted from Table 1, and only the values tested in a single year were used. The concentrations and over-standard rate in each year were the weighted averages of samples in the corresponding test year: Yyear = ∑jNjYj/∑jNj, where Nj and Yj denote the jth sample size and jth sample value, respectively, within the corresponding test year in Table 1
Fig.5 Comparison of change patterns of indoor formaldehyde average concentrations between (a) the big cities and the medium-small cities and (b) East China and the other areas. Data were adopted from Table 1, and only the values tested in a single year were used. The concentrations in each year were the weighted averages of samples in the corresponding test year: Yyear = ∑jNjYj/∑jNj, where Nj and Yj denote the jth sample size and jth sample value, respectively, within the corresponding test year in Table 1. Beijing, Dalian, Shenyang, Tianjin, Xi'an, Chengdu, Chongqing, Nanjing, Shanghai, Wuhan, Changsha, and Hangzhou in Table 1 are categorized as “big cities,” whereas the other cities in Table 1 are categorized to “medium-small cities.” Beijing, Tianjin, Hebei, Shandong, Jiangsu, Shanghai, Zhejiang, Fujian, Guangdong, and Hainan belong to “East China,” whereas the other provinces belong to the “other areas.”
Fig.6 Trends of indoor formaldehyde average concentrations (a) and over-standard rates (b) with room temperature. Data were extracted from Table 1 and adopted from references: ■[74], ●[94],▲[37], ▼[95], ◆[18], ?[18], ?[34], ★[40], ??56, and ?96. Median concentrations were used in references ●[94], ▲[37], and ?[96]
Fig.7 Trends of indoor formaldehyde average concentrations (a) and over-standard rates (b) with relative humidity. Data were adopted from references: ■[28], ●[40], ▲[34], and ★[37]
Fig.8 Profiles of air temperature (T), relative humidity (RH), and absolute humidity (AH) in an annual cycle for typical northern city Beijing and typical southern city Hangzhou in China. (a) Air temperature, RH, (b) air temperature, and AH. Data were obtained from China Meteorological Data Service Centre (http:∥data.cma.cn). Each value is the annual average between 1981 and 2010. RH was calculated from water vapor pressure based on Magnus equation[106]
Fig.9 Seasonal variations of indoor formaldehyde average concentrations, the highest concentrations, the lowest concentrations, and over-standard rates. N denotes the sample size of each group. Data were adopted from Table 1. Data with specific test month/season were classified to the corresponding season, data spreading in a full year was classified into the “full year” group, the remaining data were classified into the “unspecified” group. Values in each group were the weighted averages of the corresponding samples: Yseason = ∑kNkYk/∑kNk, where Nk and Yk denote the kth sample size and kth sample value, respectively, within the corresponding group in Table 1
Fig.10 Seasonal trends of indoor formaldehyde average concentrations, the highest concentrations, the lowest concentrations, and over-standard rates in the north and the south, respectively. The north and the south are separated by the Qinling Mountains-Huaihe River line. Data were adopted from Table 1. Data from the north and the south were treated separately. N denotes the sample size of each group. Each value in each group was the weighted average of the corresponding samples: YS-N = ∑lNlYl/∑lNl, where Nl and Yl denote the lth sample size and lth sample value, respectively, within the corresponding group in Table 1
Fig.11 Seasonal trends of indoor temperatures and average formaldehyde concentrations in the north (a) and the south (b), and indoor relative humidity and absolute humidity in the north (c) and the south (d), respectively. The north and the south are separated by the Qinling Mountains-Huaihe River line. Data of formaldehyde concentrations were adopted from Fig.10. Data of indoor temperatures were adopted from:■[107], ●[108], ▲[109], ▼[110], ◆[111], ?[112], ★[74], and ??[113]. Since the average concentrations, highest concentrations, and over-standard rates followed the same trends, only the average concentrations were illustrated
Fig.12 Window opening status in bedrooms at night in urban China. Data were calculated from reference[89]. Values in the north were the weighted averages of the severe cold zone and cold zone, and values in the south were the weighted averages of the mild zone, hot summer cold winter zone, and hot summer warm winter zone. The weight in each zone was the ratio of number of dwellings in the corresponding zone to the total number of dwellings in the north or the south
Fig.13 Average concentrations, the highest concentrations, lowest concentrations, and over-standard rates of indoor formaldehyde for different types of rooms. N denotes the sample size of each room type. Data were adopted from Table 1. Data from the specific room was classified to the corresponding room type, data from the whole house was classified to the “unspecified” group, data combined from several specific rooms was not adopted. The data of the dining room were combined with the living room group. Values in each group were the weighted averages of corresponding samples: Yroom = ∑mNmYm/∑mNm, where Nm and Ym denote the mth sample size and mth sample value, respectively, within the corresponding room type in Table 1
Fig.14 Long-term decay patterns of average concentrations (a), the lowest concentrations (b), the highest concentrations (c), and over-standard rates (d) of indoor formaldehyde. N denotes the sample size. Data were adopted from Table 1. The time after decoration was determined as follows: If a specific time was given, this time was adopted; if a period was given, the median time of this period was adopted; newly decorated was assigned as 1 month; if it was within a time, half of this time was adopted; if it was longer than a time, this time was adopted. Data in periods spreading over 2 years and data not specified the time after decoration was not used
[1]
Salthammer T, Mentese S, Marutzky R. Chem. Rev., 2010, 110(4): 2536.

doi: 10.1021/cr800399g pmid: 20067232
[2]
WHO. Formaldehyde. IARC Monographs on the Evaluation of Carcinogenic Risks to Humans, 2006. 88. [2021-03-01]http://www.inchem.org/documents/iarc/vol88/volume88.pdf.
[3]
UNEP-Publications. Formaldehyde. SIDS Assessment Report, 2002. [2021-03-01]http://www.inchem.org/documents/sids/sids/FORMALDEHYDE.pdf.
[4]
WHO. Formaldehyde. Concise International Chemical Assessment Document 40, 2002, http://www.inchem.org/documents/cicads/cicads/cicad40.htm.
[5]
Huang L H, Mo J H, Sundell J, Fan Z H, Zhang Y P. PLoS One. 2013, 8 (11): e79553.

doi: 10.1371/journal.pone.0079553
[6]
Wang H X, Li H C, Lv M Q, Zhou D X, Bai L Z, Du L Z, Xue X, Lin P, Qiu S D. Sci. Rep., 2015, 5: 15874.

doi: 10.1038/srep15874
[7]
Duong A, Steinmaus C, McHale C M, Vaughan C P, Zhang L P. Mutat. Res-Rev. Mutat. Res., 2011, 728 (3): 118.

doi: 10.1016/j.mrrev.2011.07.003
[8]
Xu W J, Zhang W Q, Zhang X Z, Dong T W, Zeng H Q, Fan Q Y. Medicine, 2017, 96(26): e7146.

doi: 10.1097/MD.0000000000007146
[9]
Le Cann P, Bonvallot N, Glorennec P, Deguen S, Goeury C, Le Bot B. Int. J. Hyg. Environ. Health, 2011, 215 (1): 1.

doi: 10.1016/j.ijheh.2011.07.008
[10]
Hao L J. China Quality Certification. 2018, 12: 38.
(郝丽娟. 质量与认证, 2018, 12: 38.).
[11]
Yu X, Cui X L. Fangyuan Magazine, 2018, 17: 62.
(于潇, 崔晓丽. 方圆, 2018, 17: 62.).
[12]
Tang X J, Bai Y, Duong A, Smith M T, Li L Y, Zhang L P. Environ. Int., 2009, 35(8): 1210.

doi: 10.1016/j.envint.2009.06.002
[13]
Ye W, Zhang X, Gao J, Cao G Y, Zhou X, Su X. Sci. Total. Environ., 2017, 586: 696.

doi: 10.1016/j.scitotenv.2017.02.047
[14]
Huang S D, Wei W J, Weschler L B, Salthammer T, Kan H D, Bu Z M, Zhang Y P. Sci. Total. Environ., 2017, 590: 394.
[15]
Lv T F, Yuan M, Lv Y B, Xue L D. Environ. Chem., 2016, 35(10): 2191.
(吕天峰, 袁懋, 吕怡兵, 薛荔栋. 环境化学, 2016, 35(10): 2191.).
[16]
Yu S M, Chen L, Gao Y J, Feng L. J. Pub. Health. Prev. Med., 2016, 27(3): 25.
(俞苏蒙, 陈林, 高彦军, 冯莉. 公共卫生与预防医学, 2016, 27(3): 25.).
[17]
Fan G T, Xie J C, Ji Y B, Li Z H, Zhang H B, Li N P, Lv Y, Zhu C W, Liu J P. Environ. Chem., 2015, 34(6): 1215.
(樊广涛, 谢静超, 吉野博, 李振海, 张会波, 李念平, 吕阳, 朱晟伟, 刘加平. 环境化学, 2015, 34(6): 1215.).
[18]
Yao X Y, Wang W, Chen Y L, Zhang W L, Song Y, Liu S Q, Gao X, Huang H, Qu L P, Liu Y P, Liu H L, Qi Q P. J. Envrion. Health, 2005, 22(5): 353.
(姚孝元, 王雯, 陈元立, 张文丽, 宋钰, 刘遂谦, 高星, 黄浩, 曲莉萍, 刘亚平, 刘洪亮, 戚其平. 环境与健康杂志, 2005, 22(5): 353.).
[19]
Fang J L, Yang X, Li H, Dong X Y, Li Y P, Tang Z G, Xu D Q. J. Envrion. Health., 2014, 31(7): 585.
(方建龙, 杨旭, 李红, 董小艳, 李韵谱, 唐志刚, 徐东群. 环境与健康杂志, 2014, 31(7): 585.).
[20]
Bao X G, Niu Y, Wang F. J. Heilongjiang College Edu., 2015, 34(1): 184.
(包新国, 牛颖, 王芳. 黑龙江教育学院学报, 2015, 34(1): 184.).
[21]
Wang S Z, Zhao W K, Zhao T. North Environ., 2004, 3: 4.
(王诗哲, 赵文奎, 赵彤. 北方环境, 2004, 3: 4.).
[22]
Ren K, Liu J P. Chin. J. Public Health Eng., 2007, 6(3): 184.
(任凯, 刘剑平. 中国卫生工程学, 2007, 6(3): 184.).
[23]
An L. J. Environ. Health., 2016, 33(12): 1077.
(安乐. 环境与健康杂志, 2016, 33(12): 1077.).
[24]
Hu Y N, Xia H J, Zhu L. Occup. Health Emerg. Rescue., 2017, 35(5): 438.
(胡亚男, 夏慧杰, 祝琳. 职业卫生与应急救援, 2017, 35(5): 438.).
[25]
Yang Y J. China Sci. Tech. Information, 2007, 16: 16.
(杨永建. 中国科技信息, 2007, 16: 16.).
[26]
Zhai L L, Xu Z F, Zhao J. Pract. Prev. Med., 2010, 17(8): 1584.
(翟玲玲, 徐兆发, 赵剑. 实用预防医学, 2010, 17(8): 1584.).
[27]
Li Z X, Wang D M, Wang X Y, Zhao L, Fang Y. Tianjin Construction Sci. Tech., 2017, 27(1): 4.
(李赵相, 王冬梅, 王喜元, 赵磊, 房跃. 天津建设科技, 2017, 27(1): 4.).
[28]
Gu J, Huang X Y, Wang L F, Jan S. Chin. J. Environ. Engineer., 2017, 11(10): 5577.
(顾洁, 黄晓影, 王丽芳, Jan S. 环境工程学报, 2017, 11(10): 5577.).
[29]
Luo L. Arid. Environ. Monitor., 2018, 32(3): 130.
(罗磊. 干旱环境监测, 2018, 32(3): 130.).
[30]
Han T, He B Y, Li N. China Sci. Tech. Information, 2007, 10: 36.
(韩涛, 何秉宇, 李娜. 中国科技信息, 2007, 10: 36.).
[31]
Liu T T. Chem. Management, 2018, 33: 132.
(刘婷婷. 化工管理, 2018, 33: 132.).
[32]
Qin H S, Huang LN. Qinghai Environ., 2006, 16(2): 78.
(秦海山, 黄鲁宁. 青海环境, 2006, 16(2): 78.).
[33]
Qin G X, Wang P. J. Qinghai Normal University (Natural Sci.), 2008, 3: 71.
(秦桂香, 汪鹏. 青海师范大学学报(自然科学版), 2008, 3: 71.).
[34]
Li C L, Wang C E, Wang Y, Wang R. J. Gansu Lianhe University (Natual Sci.), 2013, 27(3): 29.
(李翠林, 王传娥, 王莹, 王瑞. 甘肃联合大学学报(自然科学版), 2013, 27(3): 29.).
[35]
Li S S, Li B Q, Ma X, Zhang P, Li L. Environ. protection Sci. Tech., 2017, 23(1): 12.
(李树生, 李便琴, 马肖, 张鹏, 李磊. 环保科技, 2017, 23(1): 12.).
[36]
Zhu C L, Xie L. Sichuan Build. Mater., 2015, 41(5): 121.
(朱春兰, 谢亮. 四川建材, 2015, 41(5): 121.).
[37]
Wu H Q, Liu Z Z, Gao X F. Occup. Health., 2016, 32(7): 957.
(吴汉奇, 刘振中, 高晓凤. 职业与健康, 2016, 32(7): 957.).
[38]
Li X M, Zhang Z Q, Yu S D. Sichuan Environ., 2015, 34(6): 70.
(李晓曼, 张自全, 余世东. 四川环境, 2015, 34(6): 70.).
[39]
Zeng F L, Wang H, Yang H B, Chen C R. Sichuan Environ., 2008, 4: 48.
(曾凡丽, 王槐, 杨海波, 陈长容. 四川环境, 2008, 4: 48.).
[40]
Tang Y F, Wang Y, Chu Y H, Yin H. J. Envrion. Health., 2012, 29(3): 265.
(唐玉凤, 王妍, 楚英豪, 尹辉. 环境与健康杂志, 2012, 29(3): 265.).
[41]
Wang S M, Ding W Q, Li C P. J. Environ. Occup. Med., 2010, 27(7): 441.
(王书敏, 丁武泉, 李昌朋. 环境与职业医学, 2010, 27(7): 441.).
[42]
Li T T, Liu Z R, Bai Y H. Bull. Environ. Contam. Toxicol., 2008, 81(2): 200.

doi: 10.1007/s00128-008-9409-6
[43]
Liu L Y, Wang Y F, Zhou C, Zhang W G. J. Environ. Hygiene, 2012, 2(6): 271.
(刘利亚, 王娅芳, 周昌, 张卫国. 环境卫生学杂志, 2012, 2(6): 271.).
[44]
Qian L Y, He P. Environ. Sci. Survey, 2007, 26(3): 52.
(钱丽艳, 何平. 环境科学导刊, 2007, 26(3): 52.).
[45]
Xu B F, Hu Y F, Zhou M. Ecol. Econ., 2005, 8: 88.
(徐冰峰, 胡跃峰, 周明. 生态经济, 2005, 8: 88.).
[46]
Zhuang Y, Lu Y W, Bai Y B, Zhou Y G, Zi Y M, Xiao B R, He Y, Yang Z H. Yunnan Environ. Sci., 2006, 25(4): 44.
(庄严, 卢云雯, 白云宝, 周跃光, 字跃梅, 肖本润, 何燕, 杨宗慧. 云南环境科学, 2006, 25(4): 44.).
[47]
Pang X G. Popular Standardization, 2006, 5 (S1): 46.
庞小刚. 大众标准化, 2006, 5 (S1): 46.)
[48]
Zhang H J. Energy Energy Conservation, 2013, 12: 90.
(张红俊. 能源与节能, 2013, 12: 90.).
[49]
Liu S M. North Environ., 2011, 23(9): 31.
(刘素敏. 北方环境, 2011, 23(9): 31.).
[50]
Sun Z, Wang W R, Zhang Y. Chin. J. PHM, 2013, 29(1): 92.
(孙湛, 王蔚茹, 张扬. 中国公共卫生管理, 2013, 29(1): 92.).
[51]
Zhang S X, Yu X, Ma L. Pract. Prev. Med., 2018, 25(2): 243.
(张淑霞, 于兴, 马岚. 实用预防医学, 2018, 25(2): 243.).
[52]
Zhang S X, Li Y X, Liu G. J. Med. Forum., 2009, 30(18): 67.
(张淑霞, 李云霞, 刘刚. 医药论坛杂志, 2009, 30(18): 67.).
[53]
Han J, Xu L, Zhang Q Y, Ding K, Zhang D X. J. Med. Theor. Prac., 2014, 27(23): 3217.
(韩洁, 徐磊, 张庆远, 丁可, 张东献. 医学理论与实践, 2014, 27(23): 3217.).
[54]
Xu G C, Zhao Y Z, Wu H, Zhang H X. Occup. Health., 2014, 30(16): 2326.
(徐光翠, 赵英政, 吴辉, 张合喜. 职业与健康, 2014, 30(16): 2326.).
[55]
Han W X. Prev. Med. Trib., 2011, 17(5): 411.
韩文霞. 预防医学论坛, 2011, 17(5): 411.)
[56]
Gu Z Q, Li H, Zhao J M, Jia L. Chin. J. Public Health Eng., 2008, 7(5): 289.
(谷增齐, 李红, 赵建明, 贾亮. 中国卫生工程学, 2008, 7(5): 289.).
[57]
Duan X M. J. Anhui Health Vocational Tech. College., 2003, 2(4): 82.
(段晓明. 安徽卫生职业技术学院学报, 2003, 2(4): 82.).
[58]
Chen R, Liu B, Zhang Q. J. Environ. Hygiene, 2016, 6(1): 82.
(陈茸, 刘斌, 张琦. 环境卫生学杂志, 2016, 6(1): 82.).
[59]
Li S, Huang G J, Gao A C. Development Guide Build. Mater., 2016, 14(12): 62.
(李思, 黄国君, 高艾春. 建材发展导向, 2016, 14(12): 62.).
[60]
Xu D Q, Shang B, Cao Z J. J. Hygiene Res., 2007, 36(4): 473.
(徐东群, 尚兵, 曹兆进. 卫生研究, 2007, 36(4): 473.).
[61]
Jiang Q Y, Liu P P, Wang X Y, Lu R C, Liu W, Zhou H Y, Gong Y Y, Zhou Y X, Huang C. Environ. Sci., 2018, 39 (2): 585-591.

doi: 10.1021/es035055q
(蒋巧云, 刘平平, 王雪颖, 路荣春, 刘炜, 周华元, 龚莹莹, 周亚欣, 黄晨. 环境科学, 2018, 39 (2): 585-591.)
[62]
Zheng K J, Li M Z, Shen F R, Qin J X. Occup. Health., 2014, 30(4): 537.
(郑康杰, 李明珠, 沈富荣, 秦景香. 职业与健康, 2014, 30(4): 537.).
[63]
Chi X, Shi Y Q, Yan J, Fu C H, Zhang B Y. J. Envrion. Health., 2007, 24(2): 81.
(迟欣, 石玉琴, 颜进, 付承红, 张本延. 环境与健康杂志, 2007, 24(2): 81.).
[64]
Lin H W. J. Envrion. Health., 2007, 24(5): 327.
(林宏伟. 环境与健康杂志, 2007, 24(5): 327.).
[65]
Xue S G, Ma Y M, Li L J, Huang Y H, Wang J. J. Civil. Architect. Environ. Engineer., 2011, 33(3): 124.
(薛生国, 马亚梦, 李丽劼, 黄艳红, 王钧. 土木建筑与环境工程, 2011, 33(3): 124.).
[66]
He A T, Yang S Y, Li C, Zhou Y, Liu J G. Prac. Prev. Med., 2009, 16(1): 140.
(何爱桃, 杨胜园, 李程, 周艺, 刘吉光. 实用预防医学, 2009, 16(1): 140.).
[67]
Liang J. Occup. Health., 2014, 30(23): 3431.
(梁军. 职业与健康, 2014, 30(23): 3431.).
[68]
Zhang L, Wan Z Y, Yang X, Li Y. Jiangxi Sci., 2007, 25(4): 476.
(张丽, 万志勇, 杨辛, 李莹. 江西科学, 2007, 25(4): 476.).
[69]
Guo M, Pei X Q, Mo F F, Liu J L, Shen X Y. J. Environ. Sci., 2013, 25(5): 908.

doi: 10.1016/S1001-0742(12)60170-3
[70]
Tong D Q, Huang S Y. Contemporary Medicine, 2008, 14(24): 179.
(佟冬青, 黄胜勇. 当代医学(学术版), 2008, 14(24): 179.).
[71]
Zeng Y D, Wu X N, Wang J L. Strait. J. Prev. Med., 2005, 11(6): 57.
(曾毅丹, 吴小南, 汪家梨. 海峡预防医学杂志, 2005, 11(6): 57.).
[72]
Tang W J, Lin S H, Xie X Y, Ke Z Z, Yu X L, Gao Z. Strait. J. Prev. Med., 2003, 9(5): 13.
(唐文娟, 林嗣豪, 谢星云, 柯宗枝, 余雪林, 高忠. 海峡预防医学杂志, 2003, 9(5): 13.).
[73]
Ye X S. Fujian Analysis Test, 2005, 14(4): 2312.
(叶学胜. 福建分析测试, 2005, 14(4): 2312.).
[74]
Lei N S, Zhou R Y, Chen T, Liu Z H, Zhong G M, Li Y S, Li Z, Huang J P. Modern Prev. Med., 2015, 42(8): 1389.
(雷宁生, 周润煜, 陈涛, 刘展华, 钟格梅, 李裕生, 黎智, 黄江平. 现代预防医学, 2015, 42(8): 1389.).
[75]
Meng M W, Qi C L, Liu Q Y, Hong W, Jiang Z, Liu M D, Deng X M. J. Environ. Hygiene., 2015, 5(2): 99.
(蒙冕武, 齐丛亮, 刘庆业, 洪威, 江周, 刘明登, 邓希敏. 环境卫生学杂志, 2015, 5(2): 99.).
[76]
Huang N, Tian Y, Huang L M, Liang L L, Chen D Y, Tan S. Urban Environ. Urban Ecology, 2015, 28(6): 10.
(黄宁, 田艳, 黄良美, 梁柳玲, 陈德翼, 覃莎. 城市环境与城市生态, 2015, 28(6): 10.).
[77]
Wu Z C. Build. Mater. Decoration, 2019, 11: 59.
(吴志翀. 建材与装饰, 2019, 11: 59.).
[78]
Ling H, Zhou G P. Guangzhou Chem. Ind., 2015, 43(13): 136.
(凌晖, 周桂萍. 广州化工, 2015, 43(13): 136.).
[79]
Guo Y, He L F, Li Y, Zhang H L. J. Environ. Hygiene., 2016, 6(1): 88.
(郭艳, 何伦发, 李玉, 张浩玲. 环境卫生学杂志, 2016, 6(1): 88.).
[80]
Li J P, Fu X C, Sun Y, Lin S L. China Tropical Medicine, 2012, 12(11): 1400.
(黎健萍, 傅小彩, 孙勇, 林绍良. 中国热带医学, 2012, 12(11): 1400.).
[81]
Xiao S, Long W F, Yang J J, Liu Y R, Liu Y M, Yu D E. China Tropical Medicine. 2016, 16 (2): 124-126.
(肖莎, 龙文芳, 杨建军, 刘云儒, 刘玉梅, 于德娥. 中国热带医学, 2016, 16 (2): 124-126.)
[82]
Liu X P, Song Y. Guangxi Energy Conservation, 2009, 04: 35.
(刘学圃, 宋扬. 广西节能, 2009, 04: 35.).
[83]
He X F, Wang G S. J. Shenzhen Institute Inform. Tech., 2008, 6(2): 10.
(贺小凤, 王国胜. 深圳信息职业技术学院学报, 2008, 6(2): 10.).
[84]
Yang S. Occup. Health., 2006, 22(21): 1813.
(杨声. 职业与健康,2006, 22(21): 1813.).
[85]
Giesen R, Schripp T, Markewitz D, Meyer B, Schwab H, Uhde E, Salthammer T. Anal. Lett., 2016, 49(10): 1613.

doi: 10.1080/00032719.2015.1107083
[86]
Huang J, Wang M Q, Zhang J Z, Zhang X, Kuang S Y. Sci. Travel. Med., 2002, 8(3): 18.
(黄杰, 王明清, 张建珍, 张旭, 匡颂尧. 旅行医学科学, 2002, 8(3): 18.).
[87]
Zhang Y P, Lv B. China Wood-Based Panels, 2019, 26(7): 29.
(张玉萍, 吕斌. 中国人造板, 2019, 26(7): 29.).
[88]
Guo Q J. Analysis and countermeasures of wood-based panel industry development in China. PhD Thesis, Beijing Forestry University, 2011.
(郭青俊. 中国人造板产业发展分析及对策研究. 博士, 北京林业大学, 2011.).
[89]
Hou J, Sun Y X, Chen Q Y, Cheng R S, Liu J J, Shen X, Tan H W, Yin H G, Huang K L, Gao Y, Dai X L, Zhang L M, Liu B W, Sundell J. Indoor Air, 2019, 29(5): 828.

doi: 10.1111/ina.12582
[90]
Dai X L, Liu J J, Yin Y H, Song X, Jia S S. Build. Environ., 2018, 127: 98.

doi: 10.1016/j.buildenv.2017.10.036
[91]
Hou J, Zhang Y F, Sun Y X, Wang P, Zhang Q N, Kong X R, Sundell J. Build. Environ., 2018, 132: 273.

doi: 10.1016/j.buildenv.2018.01.030
[92]
Hou J, Zhang Y, Sun Y, Wang P, Zhang Q, Kong X, Sundell J. Procedia Engineer., 2017, 205: 2254.

doi: 10.1016/j.proeng.2017.10.069
[93]
Zhou J Y, Shen Z X, Dang W P, Wang L Q, Cao J J, Huang Y. Environ. Chem., 2015, 34(9): 1642.
(周霁阳, 沈振兴, 党文鹏, 王琳庆, 曹军骥, 黄宇. 环境化学, 2015, 34(9): 1642.).
[94]
Zhang H X, Zhang M Y, Sun X B, Wan B Y. J. Health Res., 2018, 47(5): 842.
(张海霞, 张美云, 孙晓冰, 万博宇. 卫生研究, 2018, 47(5): 842.).
[95]
Yao X Q, Zhang S J, An Q, Jiang X. Studies Trace Elements Health., 2005, 6: 68.
(姚晓青, 张胜军, 安乾, 蒋欣. 微量元素与健康研究, 2005, 6: 68.).
[96]
Sun X B, Zhang H X, Wan B Y, Zhang M Y. Pract. Prev. Med., 2018, 25(11): 1377.
(孙晓冰, 张海霞, 万博宇, 张美云. 实用预防医学, 2018, 25(11): 1377.).
[97]
Wang L Q, Dong J M, Xu L, Tang L Y, Liang C, Li Z L, Wang D X, Wei G. J. Environ. Hygiene, 2015, 5(3): 226.
(王灵秋, 董钧铭, 徐林, 唐礼营, 梁灿, 李再林, 王德祥, 韦刚. 环境卫生学杂志, 2015, 5(3): 226.).
[98]
Xiong J Y, Wei W J, Huang S D, Zhang Y P. Environ. Sci. Technol., 2013: 130709124156006.
[99]
Jiang C J, Li D D, Zhang P Y, Li J G, Wang J, Yu J G. Build. Environ., 2017, 117: 118.

doi: 10.1016/j.buildenv.2017.03.004
[100]
Liang W H, Yang S, Yang X D. Environ. Sci. Technol., 2015, 49(17): 10349.

doi: 10.1021/acs.est.5b02217
[101]
Sidheswaran M, Chen W H, Chang A, Miller R, Cohn S, Sullivan D, Fisk W J, Kumagai K, Destaillats H. Environ. Sci. Technol., 2013, 47(10): 5336.

doi: 10.1021/es400290p pmid: 23597095
[102]
Park B D, Jeong H W. Int. J. Adhes. Adhes., 2011, 31(6): 524.

doi: 10.1016/j.ijadhadh.2011.05.001
[103]
Liang W H, Lv M Q, Yang X D. Build. Environ., 2016, 98: 80.

doi: 10.1016/j.buildenv.2015.12.024
[104]
Xiong J Y, Zhang P P, Huang S D, Zhang Y P. Environ. Res., 2016, 151: 734.

doi: 10.1016/j.envres.2016.09.003
[105]
Johnston C J, Nielsen T R, Toftum J. Build. Simul., 2020, 13(1): 185.

doi: 10.1007/s12273-019-0567-8
[106]
Wang F F. Countryside Sci. Tech., 2017, 22: 90.
(王芬芬. 乡村科技, 2017, 22: 90.).
[107]
Sun H B, Zhao S L, Qi P. Rock Mineral Anal., 2008, 27(2): 158.
(孙红宾, 赵素利, 祁鹏. 岩矿测试, 2008, 27(2): 158.).
[108]
Bai L J, Song B, Yang L. Build Energy Efficiency, 2014, 42(11): 68.
(白鲁建, 宋冰, 杨柳. 建筑节能, 2014, 42(11): 68.).
[109]
Yang Q, Yang L, Liu J P. Refrig. Air Cond., 2011, 25(1): 49.
(杨茜, 杨柳, 刘加平. 制冷与空调, 2011, 25(1): 49.).
[110]
Qu W Y, Yan H Y, Yang L, Zheng W X. Build. Sci., 2014, 30(2): 51.
(屈万英, 闫海燕, 杨柳, 郑武幸. 建筑科学, 2014, 30(2): 51.).
[111]
Wang Z J, Ning H R, Ren J, Ji Y C. HV & AC, 2015, 45(11): 73.
(王昭俊, 宁浩然, 任静, 吉玉辰. 暖通空调, 2015, 45(11): 73.).
[112]
Zhang M F, Zhang H L. HV & AC, 2012, 42(1): 61.
(张敏飞, 张华玲. 暖通空调, 2012, 42(1): 61.).
[113]
Shi J, Su W, Lv J, Song D X. Build Energy Environ., 2008, 27(1): 75.
(史洁, 苏伟, 吕晶, 宋德萱. 建筑热能通风空调, 2008, 27(1): 75.).
[114]
Zhao L F. Henan J. Prev. Med., 2018, 29(11): 850.
(赵立峰. 河南预防医学杂志, 2018, 29(11): 850.).
[115]
Zhang Y, Yin Y R, Zhang W G. Fujian Anal. Test., 2016, 25(3): 32.
(张元, 尹亚茹, 张卫国. 福建分析测试, 2016, 25(3): 32.).
[116]
Li Z X, Liu F D, Wang D M, Fu C, Sun Y J. Sichuan Environ., 2016, 35(6): 1.
(李赵相, 刘凤东, 王冬梅, 傅超, 孙英健. 四川环境, 2016, 35(6): 1.).
[117]
Zhang R H, Fang Z Q. J. Environ. Occup. Med., 2014, 31(12): 950.
(张人华, 方志青. 环境与职业医学, 2014, 31(12): 950.).
[118]
Brown S K. Indoor Built. Environ., 2001, 10(3/4): 160.

doi: 10.1177/1420326X0101000307
[119]
Brown S K. Indoor Air-Int. J. Indoor Air Qual. Clim., 1999, 9(3): 209.
[120]
Xu Y, Zhang Y P. Atmos. Environ., 2003, 37(18): 2497.

doi: 10.1016/S1352-2310(03)00160-2
[121]
Huang H Y, Haghighat F. Build. Environ., 2002, 37(12): 1349.

doi: 10.1016/S0360-1323(01)00116-0
[122]
Yang X, Chen Q, Zhang J S, Magee R, Zeng J, Shaw C Y. Build. Environ., 2001, 36(10): 1099.

doi: 10.1016/S0360-1323(00)00078-0
[1] Jiliang Guo, Jianfei Peng, Ainan Song, Jinsheng Zhang, Zhuofei Du, Hongjun Mao. Studies on the Formation of Secondary Organic Aerosol from Vehicle Exhaust [J]. Progress in Chemistry, 2023, 35(1): 177-188.
[2] Bingjie Zhang, Qian S. Liu, Qunfang Zhou, Jianqing Zhang, Guibin Jiang. Neurotoxicological Effects of Nanosilver [J]. Progress in Chemistry, 2018, 30(9): 1392-1402.
[3] Kunlun Yang, Jiasheng Zhou, Dan Lv, Yue Sun, Zimo Lou, Xinhua Xu*. Preparation and Application of Iron-Based Composite Materials for the Removal of Antimony from Aqueous Solution [J]. Progress in Chemistry, 2017, 29(11): 1407-1421.
[4] Meng Qingbin Liu Keliang. Progress in the Research of Peptide Self-Assembly [J]. Progress in Chemistry, 2009, 21(11): 2411-2423.