


1 引言
2 拉曼光谱检测微纳塑料的常用方法
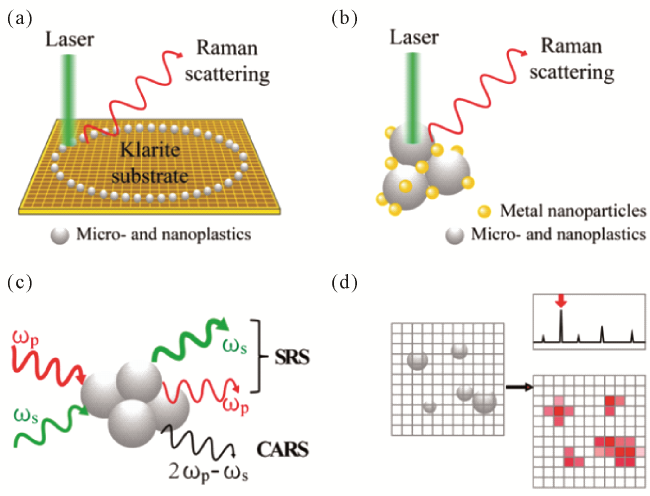
图1 (a)在Klarite表面增强基底上形成“咖啡环”;(b)金属纳米颗粒胶体表面增强Raman信号示意图;(c)两种相干Raman光谱机理图;(d)Raman光谱成像示意图Fig. 1 (a) Schematic diagram of the formation of “coffee ring” on Klarite surface-enhanced substrates ;(b) Schematic diagram of the colloidal surface-enhanced Raman signals of metal nanoparticles; (c) Mechanism of the two coherent Raman spectra; (d) Schematic diagram of Raman spectroscopic imaging |
2.1 拉曼光谱原理和常用拉曼光谱检测方法
2.2 表面增强拉曼光谱
表1 金属纳米阵列基底在检测微纳塑料中的应用Table 1 The application of metal nanoarray substrates in the detection of micro- and nanoplastics |
| Class | SERS material or structure | Target | Dispersed System | Limit of detection | Excitation wavelength | ref | |
|---|---|---|---|---|---|---|---|
| Non-membrance pattern | Klarite | PS, PMMA≥360 nm | Pure water | Single nanoplastic | 785 nm | 35 | |
| PET, PMMA≥450 nm | Atmospheric Aerosols | ||||||
| SiO2 PC@Ag | PS 100~1000 nm | Pure water | Single nanoplastic | 633 nm | 36 | ||
| Bottled, river, and tap water spiked samlpes | 5 µg/g | ||||||
| AAO/MoS2/Ag | PS 100~300 nm | Pure water | - | 532 nm | 37 | ||
| Au/Ag triangular cavity array | PS 50~1000 nm | Pure water | 10 µg/g | 532 nm | 38 | ||
| PET 88.2 nm | Bottled water | - | |||||
| Ag/ZnO@PDMS | PS 800 nm | Pure water | 25 µg/mL | 785 nm | 39 | ||
| Spiked samples of tap water, lake water, river water, seawater | Tap water 25 µg/mL;lake water 28 µg/mL;river water 35 µg/mL; Seawater 60 µg/mL | ||||||
| Non-membrance pattern | AuNPs@V-shaped AAO | PS, PMMA≥1 µm | Pure water | Single particle | 785 nm | 40 | |
| PS≥2 µm | Spiked samples of rain water | ||||||
| Au nanoparticles self-assembled on a glass slide | PS 161 nm; 33 nm PET 62 nm | Pure water | PS 10 µg/mL PET 15 µg/mL | 785 nm | 32 | ||
| Silver-coated gold nanostars inserted into anodized aluminum oxide (AAO) nanopore | PS≥400 nm | Pure water | 50 µg/mL | 633 nm | 41 | ||
| Spiked samples of tap water, river water and seawater | 500 µg/mL | ||||||
| Membrane pattern | Gold nanorods assembled on cellulose | PS 84 nm;630 nm | Pure water | 100 µg/mL | 785 nm | 42 | |
| Au-AAO membrance | PS 360 nm, 500 nm, 1 µm, 2 µm, 5 µm; PMMA 360 nm, 500 nm, 2 µm, 5 µm | Pure water | Single particle | 785 nm | 43 | ||
| PS PE≥360 nm | Sea salt | ||||||
| Au nanoparticles self-assembled on filter paper | PET≥20 µm | Pure water | 100 µg/mL | 532 nm | 44 | ||
| Spiked samples of tap water and pool water | |||||||
| Self-assembly of spiked Au nanoparticles on glass fiber filter membrane | PS 20~10000 nm | Pure water | 0.1 µg/mL | 785 nm | 45 | ||
| Spiked samples of tap water and rain water | |||||||
| Silver Nanowire Membrane | PS 50~1000 nm | Pure water | 10-3 µg/mL | 785 nm | 46 | ||
| seawater | - | ||||||
表2 金属纳米颗粒胶体在检测微纳塑料中的应用Table 2 The application of metal nanoparticle colloids in the detection of micro- and nanoplastics |
| SERS material | Target | Dispersed System | Limit of detection | Excitation wavelength | Detection environment | Ref |
|---|---|---|---|---|---|---|
| Ag nanoparticles solution | PS 20~5000 nm | Pure water | 5 µg/mL | 785 nm | Direct determination in solution | 47 |
| Spiked samples of rain water and bottled water | ||||||
| Ag nanoparticles solution | PS≥100 nm | Pure water | 40 µg/mL | 785 nm | 34 | |
| Spiked of seawater | 40 µg/mL | |||||
| Ag nanoparticles solution | PS 50~500 nm | Pure water | 6.25 µg/mL | 785 nm | 48 | |
| Spiked of lake water | - | |||||
| Ag nanoparticles | PS 20 nm | Pure water | 10 µg/mL | 785 nm | Drying after mixing | 49 |
| CuO/Ag nanoparticles | PE 400 µm | Pure water | 1.6 ng/mL | 532 nm | 50 | |
| Au nanourchins | PS 600 nm | Pure water | - | 785 nm | 51 |
2.3 相干拉曼光谱
2.4 拉曼光谱成像
表3 微纳塑料Raman成像分析中转化高光谱信号的算法Table 3 Algorithm for transforming hyperspectral signals in Raman imaging analysis of micro- and nanoplastics. |
| Class | Algorithm | Advantages | Disadvantages | Ref |
|---|---|---|---|---|
| Threshold determination | Otsu's algorithm | Automatic, simple, and fast identification Applicable to both bright field and dark field microscopy Suitable for different particle sizes, shapes, colors, and transparency | Insensitive to contrast between particles and background Unable to distinguish fibers from aggregates | 82 |
| Multi-image merging | Logic-based | Cross-validation of different characteristic peak signals Effectively shields interference signals High accuracy in mapping | Complex processing workflow | 79 |
| Algebraic | Algebra-based | High computational flexibility Ability to integrate with other algorithms | Failure to consider varying contributions of different peaks Potential signal loss issues | 83 |
| Multivariate | Principal Component Analysis(PCA) | Effective extraction of critical information Independent of standard Raman spectra | Significant background interference Lower accuracy | 84 |
| PCA-linear discriminant analysis | Automatic identification of polymer types High accuracy in identifying plastic types Applicable to aged microplastics | Issues with signal loss Mismatch in feature changes | 85 | |
| Dual-PCA | High signal-to-noise ratio imaging Automatic classification of various polymers Suitable for machine learning | High computational complexity Difficulty in feature selection | 81 | |
| Multivariate curve resolution-alternating least squares | Analysis in complex backgrounds Samples require no pre-processing | Dependent on constraints High sensitivity to data noise | 86 |
3 拉曼光谱用于环境样品中微纳塑料的识别
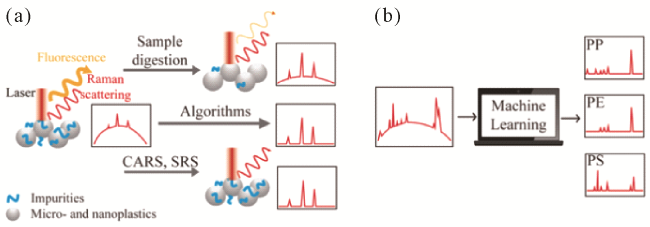
图2 (a)荧光干扰与抑制荧光技术示意图;(b)通过机器学习对环境样品中微纳塑料的Raman光谱识别处理示 意图Fig. 2 (a) Schematic diagram of fluorescence interference and suppressed fluorescence techniques; (b) Schematic diagram of Raman spectral recognition processing of micro- and nanoplastics in environmental samples by machine learning. |