


1 引言
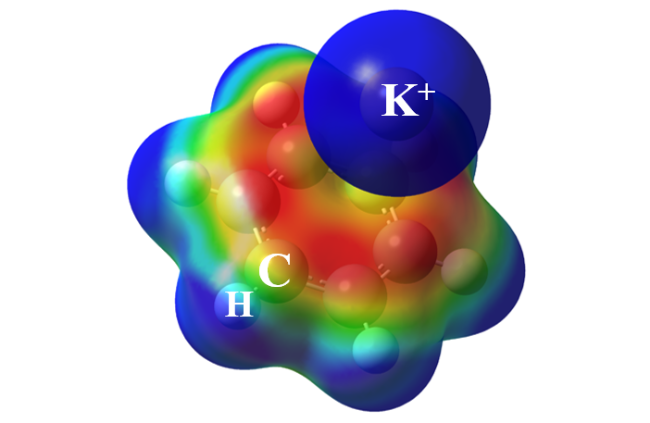
图1 苯分子和钾离子(K+)之间的阳离子-π作用模型。图中颜色从蓝到红表示分子表面静电势从正到负,球体分别代表碳原子、氢原子以及钾离子Fig. 1 Cation-π interaction between a benzene molecule and a K+ cation. Color changing from blue to red represents the electrostatic potential changing from positive to negative, balls represent C, H atoms and the K+ cation |
2 常温常压下具有反常化学计量比的二维Na2Cl/Na3Cl晶体
2.1 不饱和NaCl溶液中离子在石墨烯表面富集结晶的动力学研究
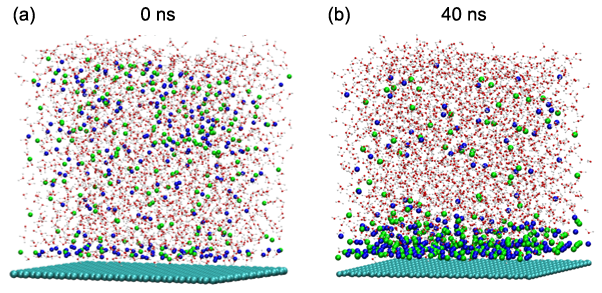
图2 不饱和NaCl溶液(3.0 mol/L)在石墨烯片层上的离子和水分子分布情况:(a)和(b)分别为0与40 ns时的模拟结果。青色、白色、红色的球分别代表碳、氢、氧原子,蓝色和绿色球分别代表钠和氯离子Fig. 2 Distribution of ions and water molecules in unsaturated NaCl solution (3.0 mol/L) on the graphene sheet: (a) and (b) show the simulation snapshots at 0 and 40 ns, respectively. The cyan, white, and red balls represent carbon, hydrogen, and oxygen atoms, respectively, and the blue and green balls represent sodium and chloride ions |
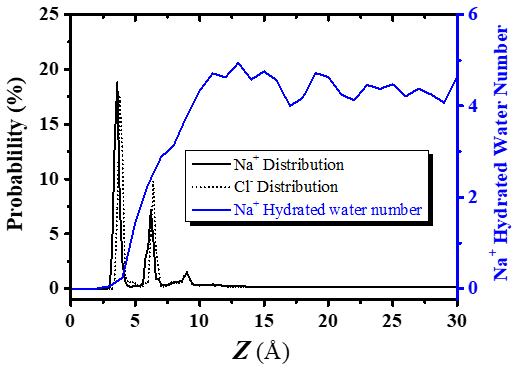
图3 不饱和NaCl溶液(3.0 mol/L)中Cl-离子(黑虚线)和Na+离子(黑实线)的概率密度分布,以及Na+离子的平均结合水数量(蓝线)在垂直于石墨烯表面的方向上随高度(Z)的变化曲线Fig. 3 Probability density distribution of Cl- anions (black dashed lines) and Na+ cations (black solid lines) in unsaturated NaCl solution (3.0 mol/L), and the average hydrated water number of Na+ cations (blue lines) with the change curve of height (Z) from the graphene surface |
2.2 石墨烯上具有反常化学计量比二维Na-Cl晶体结构的理论研究
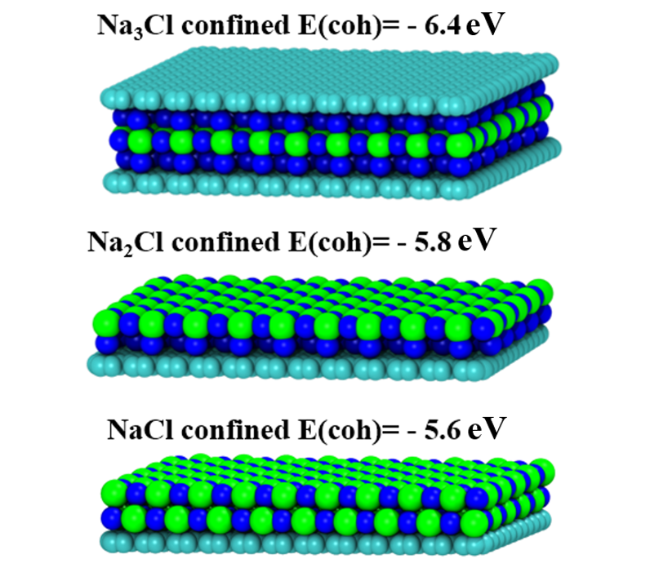
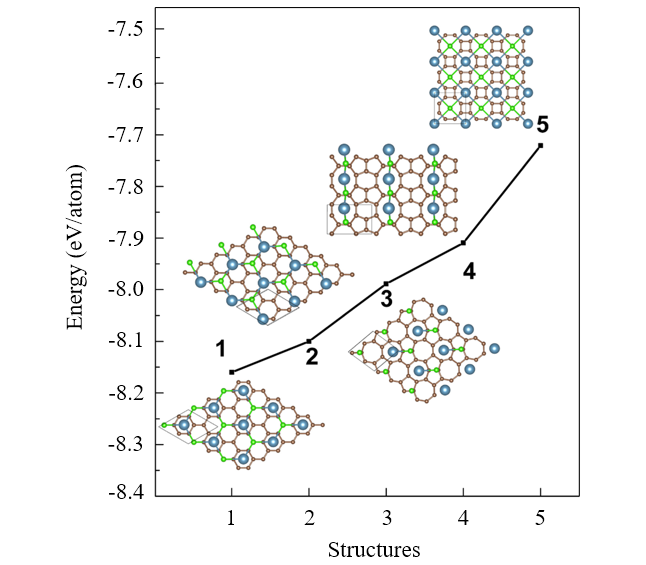
图4 石墨烯上二维Na3Cl, Na2Cl与NaCl晶体的理论预测结构及其平均内聚能(cohesive energies)Fig. 4 Theoretical prediction structure of two-dimensional Na3Cl, Na2Cl and NaCl crystals on graphene and their mean cohesive energies |
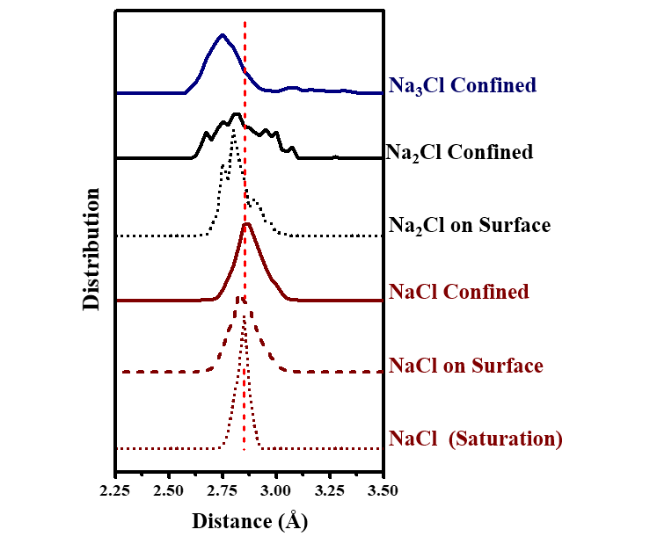
图5 不同Na-Cl晶体结构Na-Cl间距(Distance)分布情况(Distribution)的理论计算结果。红色虚线表示常规饱和结晶形成的常规三维NaCl晶体的Na-Cl间距的峰所在位置。各曲线由上到下分别代表理论计算得到的,(1)石墨烯层间的二维Na3Cl晶体,(2)石墨烯层间的二维Na2Cl晶体,(3)石墨烯表面二维Na2Cl晶体,(4)石墨烯层间的二维NaCl晶体,(5)石墨烯表面的二维NaCl晶体,以及(6)饱和结晶的三维NaCl晶体的Na-Cl间距分布情况Fig. 5 Theoretical calculations of Na-Cl distance distributions of different Na-Cl crystal structures. The red dotted line shows the location of the peak of the Na-Cl distance of a conventional three-dimensional regular NaCl crystal formed by conventional saturated crystals. The curves, from top to bottom, represent the calculated results of: (1) two-dimensional Na3Cl crystals between the graphene layers, (2) two-dimensional Na2Cl crystals between the graphene layers, (3) two-dimensional Na2Cl crystals on the graphene surface; (4) two-dimensional NaCl crystals between the graphene layers; (5) two-dimensional NaCl crystals on the graphene surface, and (6) Na-Cl distance distribution of the three-dimensional regular NaCl crystals of saturated crystals, respectively |
2.3 rGO膜上具有反常化学计量比的Na-Cl晶体的实验验证
2.3.1 rGO膜上Na-Cl晶体结构的X射线衍射(XRD)研究
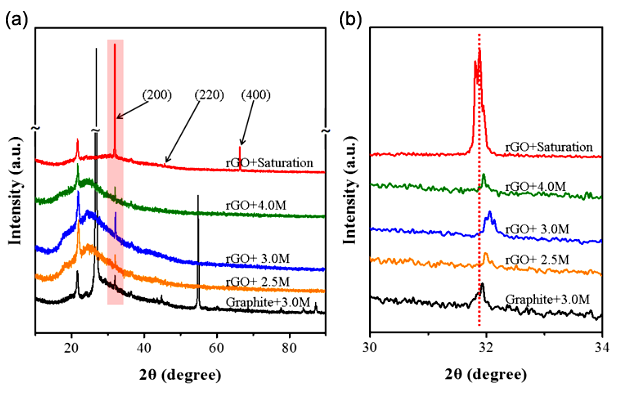
图6 (a) rGO膜浸泡在不同浓度NaCl溶液所得样品的XRD衍射谱图,线上显示的NaCl溶液浓度从上到下依次为:饱和浓度4.0,3.0,2.5 mol/L;以及石墨浸泡在3.0 mol/L NaCl溶液所得样品的XRD衍射谱图。图(b)是在32°附近的局部放大图Fig. 6 (a) XRD diffraction spectra of samples obtained by rGO membrane immersion in different concentrations of NaCl solution. The concentrations of NaCl solution shown on the line, from top to bottom, are: saturation concentrations of 4.0, 3.0, 2.5 mol/L; and XRD diffraction spectra of samples obtained by graphite immersion in 3.0 mol/L NaCl solution. (b) is a locally enlarged view near 32° |
2.3.2 rGO膜上Na-Cl晶体元素比例分析与精细晶体结构的实验探测
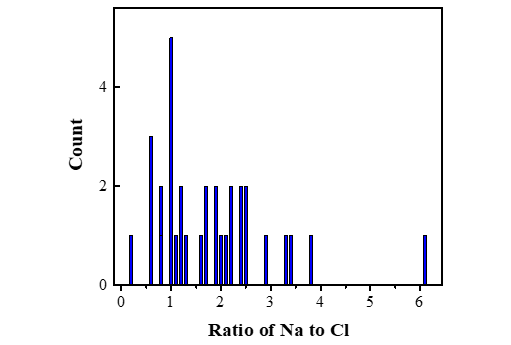
图7 rGO膜上Na-Cl晶体通过EDS测得的Na/Cl元素计量比的分布图Fig. 7 Distribution of the Na/Cl elemental ratio for Na-Cl crystals on the rGO membrane measured by EDS |
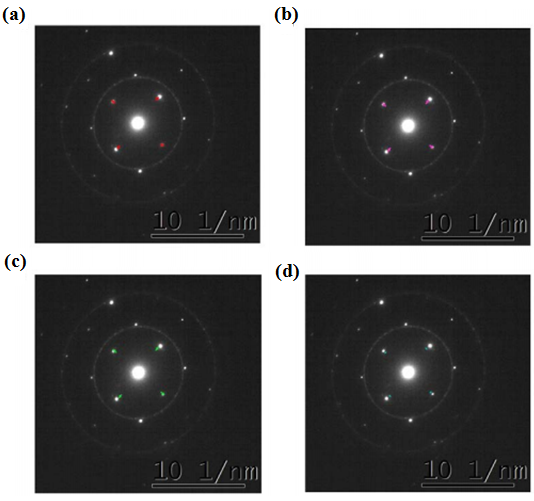
图9 Na-Cl@rGO膜样品的衍射斑点与Na-Cl结构拟合点的对比图。(a~d)中的彩色点分别为二维Na3Cl、二维Na2Cl、二维NaCl和常规三维NaCl晶体结构的拟合结果;图中白色点为实验结果Fig. 9 Comparison between diffraction spots for samples of Na-Cl@rGO membranes and predicted Na-Cl structures. The colored dots in (a~d) are the fitting results of the two-dimensional Na3Cl, two-dimensional Na2Cl, two-dimensional NaCl and conventional three-dimensional regular NaCl crystal structures, respectively; the white dots in the figure are experimental results |
3 常温常压条件下具有反常化学计量比的二维CaCl晶体
3.1 rGO膜上Ca-Cl晶体结构的冷冻透射电镜研究
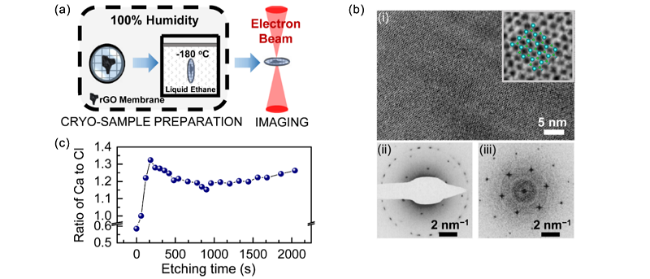
图10 非饱和盐溶液中二维Ca-Cl晶体(a)实验流程图;(b-i) 含水的rGO膜中 CaCl晶体的冷冻电镜图像,插图是高分辨率图像放大图以及CaCl理论模型的晶体结构,其中蓝绿色和绿色小球分别表示Ca和Cl原子。(b-ii) 冷冻电镜下典型CaCl晶体的衍射斑点图,是一级衍射点在(1±0.03)/4.29 Å-1的六角衍射斑点。(b-iii) 整个明场图像的傅里叶变换结果,显示与(b-ii)中六角形衍射斑点相同。(c) Ca-Cl@rGO膜内不同深度的Ca与Cl的含量比值Fig. 10 (a) Experimental preparation process of two-dimensional Ca-Cl crystals in unsaturated salt solution; (b-i) Cryo-EM images of CaCl crystals in rGO membranes with water; while the illustration is a high-resolution image magnification and the crystal structure of the CaCl theoretical model, where blue-green and green globules represent Ca and Cl atoms, respectively. (b-ii) Diffraction spotted pattern of typical CaCl crystals under cryo-EM, which is a hexagonal diffraction spot with a first-degree diffraction point at (1±0.03)/4.29 Å-1. (b-iii) Fourier transform results of the entire brightfield image, which show the same as the hexagonal diffraction spot in (b-ii). (c) Content ratio of Ca to Cl at different depths within the Ca-Cl@rGO membranes |
3.2 具有反常化学计量比的二维Ca-Cl晶体结构的理论研究
3.3 rGO膜上具有反常化学计量比的Ca-Cl晶体的铁磁性与铁磁材料应用研究
3.3.1 具有反常化学计量比的二维Ca-Cl晶体的室温铁磁性研究
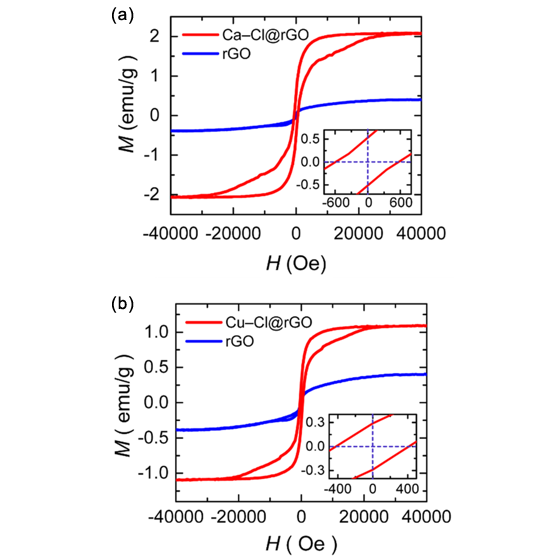
图12 rGO膜和Ca-Cl@rGO膜的干样品(a),以及Cu-Cl@rGO膜的干样品(b)的磁矩M与外加磁场H的关系图,磁场垂直于样品表面。插图是各样品剩磁和矫顽力测量结果的放大图Fig. 12 Hysteresis loop images for dry samples of rGO membranes and Ca-ClrGO membranes (a), and dry samples of Cu-ClrGO membranes (b). The magnetic field is perpendicular to the sample surface. The illustration is a magnification of the measurements of residual magnetism and coercivity in each sample |
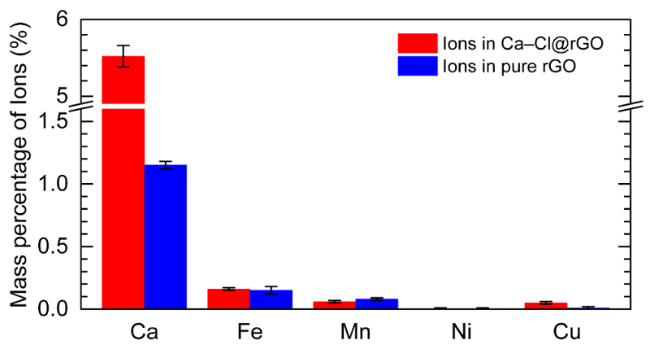
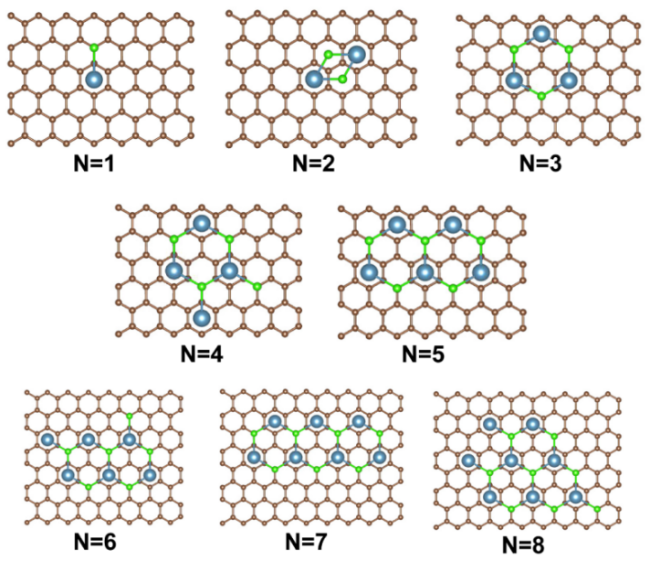
图14 相同石墨烯基底上根据CaCl@graphene结构1所构建的含有不同个数(N)的(CaCl)N晶体簇构型图,N为1~8的整数Fig. 14 Crystal cluster configurations of (CaCl)N on the same graphene substrate with different number (N), based on the structure 1 |
表1 (CaCl)N晶体簇具有的磁矩以及每个CaCl平均磁矩Table 1 Magnetic moment for (CaCl)N crystal clusters and the mean magnetic moment for each CaCl unit, respectively |
| CaCl | (CaCl)2 | (CaCl)3 | (CaCl)4 | (CaCl)5 | (CaCl)6 | (CaCl)7 | (CaCl)8 | |
|---|---|---|---|---|---|---|---|---|
| Total moment M (μB) | 0.7677 | 1.4706 | 0.4659 | 1.4136 | 0.8665 | 0.9768 | 1.5687 | 1.3728 |
| M/N (μB) | 0.7677 | 0.7353 | 0.1553 | 0.3534 | 0.1733 | 0.1628 | 0.2241 | 0.1716 |
3.3.2 具有反常化学计量比的铁磁性二维Ca-Cl晶体材料的导电性质研究
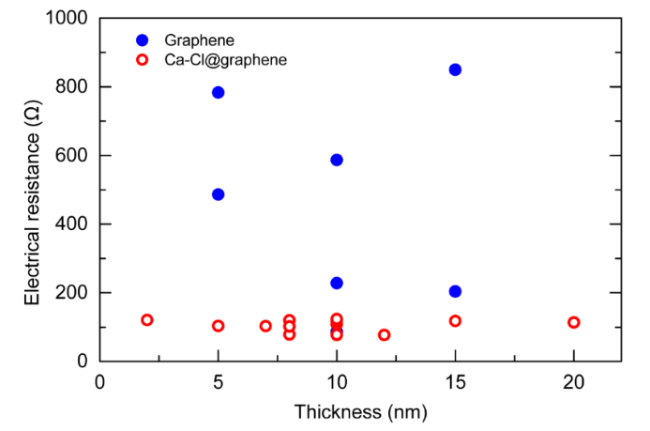
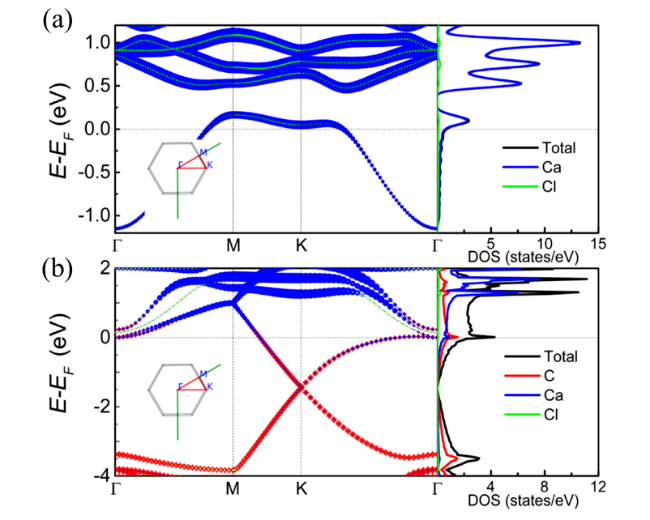
图17 理论模型的电子结构图。(a) CaCl@graphene结构1中无石墨烯基底二维Ca-Cl晶体的元素能带投影和电子态密度图;(b) 完整CaCl@graphene结构1模型中元素能带投影和电子态密度图;图(a)和(b)中点的大小表示该元素的贡献权重,插图表示在布里渊区高对称q点的路经。EF表示费米能级Fig. 17 Electronic structures of the theoretical models. Element energy bands and electron state density diagram of (a) two-dimensional Ca-Cl crystals without graphene; (b) complete CaCl@graphene model (Structure 1). The size of the dots in figures (a) and (b) represents the contribution weights of the element. The illustration shows the path of the highly symmetrical q-spot in Brillouin. EF stands for Fermi energy level |
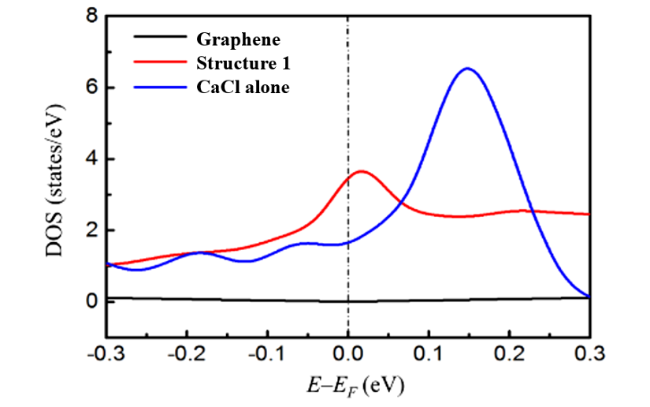
图18 理论计算三种结构在费米能级附近的电子态密度图:无石墨烯基底的二维Ca-Cl晶体模型(CaCl alone)、单层石墨烯模型(Graphene)、CaCl@graphene结构1 (Structure 1),分别用蓝色、黑色和红色表示Fig. 18 Electron state density images of the three structures near the Fermi energy level: a two-dimensional Ca-Cl crystal model (CaCl alone) without graphene substrate, a single-layer graphene model (Graphene), and CaCl@graphene model (Structure 1), represented by blue, black, and red, respectively |
3.3.3 具有反常化学计量比的铁磁性二维Ca-Cl晶体材料类压电性质实验测量
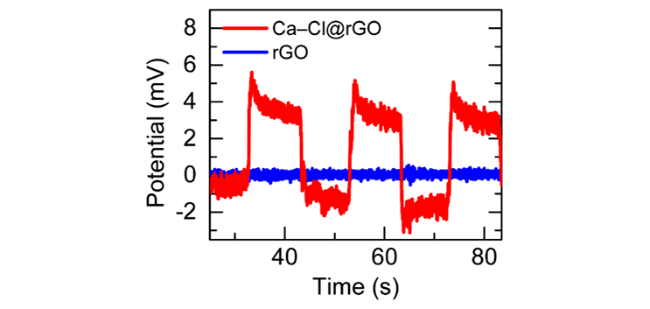
图19 Ca-Cl@rGO膜的干样品类压电特性:在弯曲角随时间的变化,且最大角度是90°条件下,Ca-Cl@rGO膜的干样品和rGO膜在周期性应变下的典型电压响应Fig. 19 Piezoelectric characteristics of Ca-ClrGO membrane: typical voltage response of dry Ca-Cl@rGO membrane and rGO membrane samples, under periodic strain under periodic strain, and with the condition that the bending angle changes with time and the maximum angle is 90° |
3.3.4 rGO膜上具有反常化学计量比的铁磁性二维Ca-Cl晶体材料的异质结测试
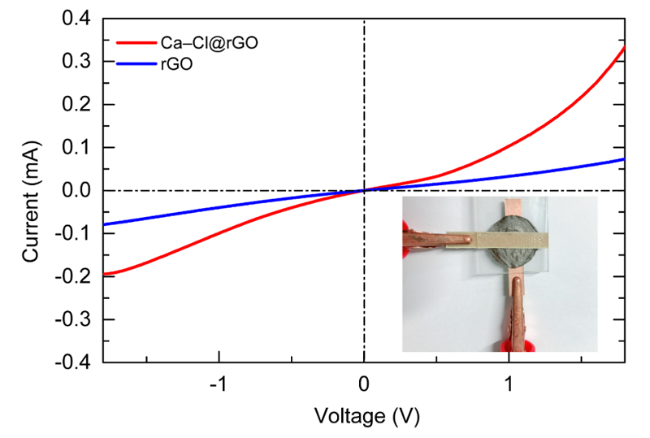
图20 Ca-Cl@rGO膜(红色)和rGO膜(蓝色)的电流-电压曲线。插图是两个铜箔电极连接rGO膜测试电流-电压曲线示意图Fig. 20 Current-voltage curve of Ca-ClrGO membrane (red) and rGO membrane (blue). The illustration is a schematic diagram of two copper foil electrodes connected to the rGO membrane, to measure the current-voltage curve |
3.4 具有反常化学计量比的二维晶体中阳离子的价态分析
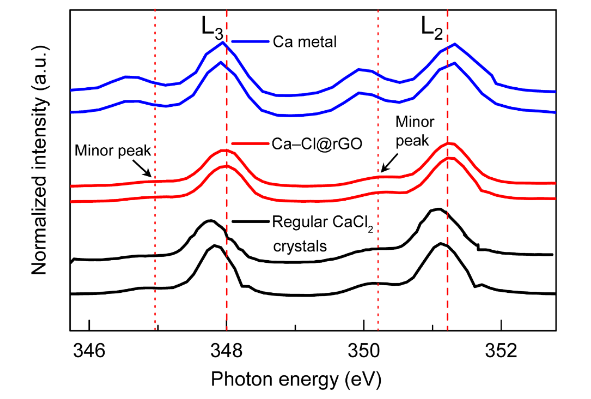
图21 金属Ca、Ca-Cl@rGO膜干样品和正常的CaCl2各两处样品区域的X射线近边吸收精细结构谱,分别用蓝色、红色、黑色实线表示Fig. 21 Calcium near-edge X-ray absorption fine structure spectra (NEXAFS) of two sampling areas of the regular calcium metal, the regular CaCl2 crystals and the Ca-Cl crystals in rGO membrane are represented by blue, red, and black solid lines, respectively |
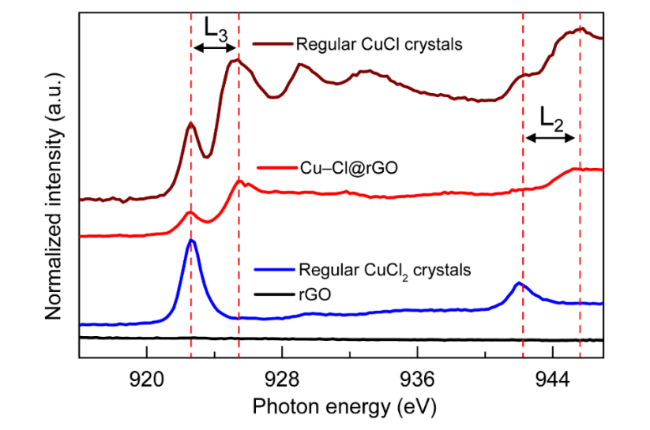
图22 Cu L3和L2边缘的三种Cu-Cl化合物的NEXAFS光谱结果图。黑色线:rGO膜;蓝色线:常规三维CuCl2晶体样品;红色线:Ca-Cl@rGO膜干样品;栗色线:常规三维CuCl晶体样品Fig. 22 NEXAFS spectra of four Cu-Cl compounds at the Cu L3, 2 edges. Black: the rGO membrane; blue: regular CuCl2 crystals; red: the Cu-Cl crystals in the dried Ca-Cl@rGO membrane; maroon: regular CuCl crystals |
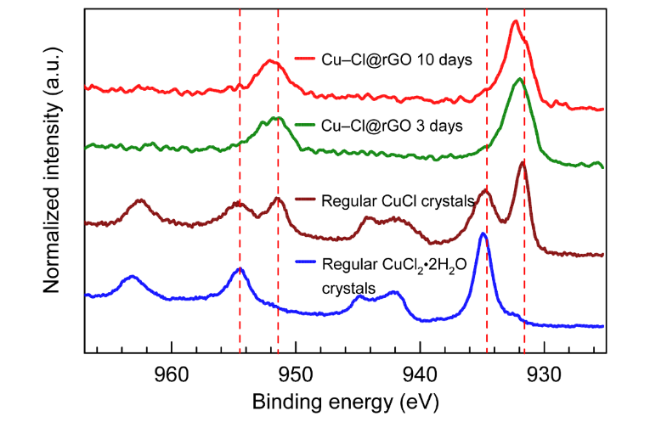
图23 rGO膜上的Cu-Cl晶体的XPS结果图。红色和绿色线分别表示制备好后存放了10天和3天的Cu-Cl@rGO膜干样品的测量结果。栗色线表示常规三维CuCl晶体样品的测量结果;蓝色线表示常规三维CuCl2晶体样品的测量结果Fig. 23 X-ray photoelectron spectroscopy (XPS) of Cu-Cl crystals in the dried rGO membranes. Red and green: the dried rGO membranes with Cu-Cl crystals had been prepared for 10 days and 3 days, respectively. Maroon: CuCl crystals; blue: regular CuCl2 crystals |